At the end of each month it's important to take a look at the long-term view for all your stocks to keep a bigger picture perspective. So much can get lost in the daily noise of the market, seemingly insignificant movement on the long-term timeframe can evoke a lot of emotion in the shorter term. By running through this simple exercise each month will keep you aware of why you really like the setup and how the position can reward you for more than just the next week or two.
The monthly bar charts I feel are generally too slow of a signal to be traded, but the general direction of the stock or market is much more apparent from this broad perspective. This view allows us to see the forest and not just obsessing over each little sapling in the undergrowth.
We always want to be investing with the long-term trend in our favor. Being able to identify that general direction will do wonders for your account balances.
Let's look at our holdings in monthly bars to see what the big picture has to say.
Charts reflect monthly closing prices as of 11/28/2014.
DIS
Our newest position, Disney, has the look of a runaway uptrend. Since breaking out above its consolidation area in 2012 DIS has never looked back. This sort of parabolic rally will concern some, but as Charles Dow once said, you never can know where you are in a trend. A trend will continue beyond what most feel is reasonable, so it's better to find a place to jump on until it comes to an end. By managing your risk you can still own a stock that has moved significantly higher because we know where we are wrong and will step aside before anything too damaging occurs.
Disney is a winner, there is no doubt about it.
NKE
Nike has made a moonshot over the past few months, but that move came out of a nice continuation "flag" area. As you may recall we entered the position just as the stock was emerging from that consolidation. This is exactly the kind of action you hope to see when you buy a stock. Most people would want to sell here, but let me ask you, why would you sell when the stock moved how you hoped it would?
TLT
Treasury Bonds have been
a choppy long-term trade, but since the beginning of 2014 the trend has been exceptional. There is still a clear pattern of higher lows and higher highs, so we would expect another new high based on how it has moved over the past 10 years.
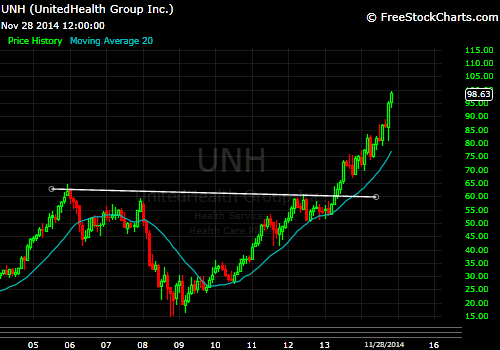
UNH
Since breaking above it's prior highs near $60, UNH has been on a tear. The 8-year base has the look of a Cup/Handle pattern and would still suggest more upside to come. Regardless of the fancy names you give it, since 2010 price has consistently made higher swing lows and higher swing highs. This is strong trending action and we want to continue to take advantage of the move until it ends.
BRKB
Berkshire has been extending strongly since 2013 and after breaking through the 10-month consolidation coming into 2014, the stock has been a leading performer. The move is getting a bit steep but as long as we continue to trail our stops and manage risk we can stick with it until it's done.
BMY
BMY had a huge month of October closing at new highs. The recent pause has created yet another higher swing low and the trend is still obviously higher. Using NKE has an example, price here could still be getting going since resting for over a year. The bigger the base, the higher the move in space.
SBUX
I believe Starbucks is ready for another leg higher. Since working off its huge rally, price as corrected over the last year +. This formation has the look of a continuation "flag" pattern and could extend significantly higher. The last time the stock behaved similarly was in 2012 which led to a nearly 100% move. It's certainly possible that something similar happens again.
GS
Goldman is just now emerging from a significant base formation. Breaking through $180 was a major psychological win for the a stock. The type of move that can come from a base this size could surprise many. I think a retest of the all-time highs is very likely and possibly a move beyond is certainly not out of the question.
PPG
I really like how PPG handled its recent correction and is now resuming to new highs. While the correction seems muted on the monthly chart, the weekly and daily charts show the high volatility from that October swoon. In hindsight this appears to have been just a shakeout move before continuing another leg higher.
HAIN
HAIN has emerged strongly from its 10-month consolidation and is pushing to new highs repeatedly. When a stock moves this hard in our favor it is best to just get out of the way and let it work. To see another brief pause after this big move would be constructive, but longer-term this trend is about as good as they come.
UPS
So many of these setups look similar to one another but are just at different stages. UPS is just now breaking out from its support area and looks poised to make another strong surge.
PCG
PCG looks ready to explode to the upside. After trading sideways for the better part of 7 years the breakout above the resistance area shows a sentiment shift for the positive. What I like about this chart too is that despite correcting during the financial crisis, prices regained their footing quickly and have been pressing against all-time highs for a couple years now. This shows a strong underlying support for the stock and should propel it higher now that the primary resistance has been broken.
IP
Speaking of ready to explode, IP looks ready for a pop after resolving its sideways trend over the past year. This has it all, a strong uptrend over the past 5 years, a year long support zone to launch the next move higher and new decade highs are being printed regularly as the trend resumes to the upside. When we look back on this breakout in several months I bet we see this previous 10-year trading formation as a type of Cup/Handle pattern; the recent consolidation certainly looks like a nice handle formation. If this is the case the stock would have serious long-term prospects.
GILD
GILD has been a monster performer since 2012 gaining more than 400% during that time. Shares have recently experienced some increased volatility but the long-term trend is obvious. As long as you use sound risk management principles there are still plenty of chances to participate in a stock like this. Just know that went a trend like this ends it doesn't usually end well. Holding onto a losing position as the trend begins to fail could cost you and your account balance dearly. Be sure if you choose to invest in a name like this that under no circumstance do you get married to the position. If it begins to turn against you, get out and protect your capital. Trends like this are great to participate in on the way up, but they can be equally spectacular on the way down, so plan your trade accordingly.


 Since breaking above it's prior highs near $60, UNH has been on a tear. The 8-year base has the look of a Cup/Handle pattern and would still suggest more upside to come. Regardless of the fancy names you give it, since 2010 price has consistently made higher swing lows and higher swing highs. This is strong trending action and we want to continue to take advantage of the move until it ends.


No comments:
Post a Comment