Sunday, February 28, 2016

Lg-Cap Portfolio Review

So far this year we've looked at short-term setups, Long-term Monthly charts, trading Short, general market psychology, etc. But this week I want to get back to the general focus and take a look at the market from the weekly perspective and our Large-Cap Portfolio holdings.

SP500 Weekly
 For all intents and purposes the 1820-1810 level is finding buyers. We have now seen 3 tests of that area and each time buyers have come in to support stocks. However that makes you feel (too many tests, the market is in a downtrend, its gonna crash, Head/Shoulder Top, etc) the fact remains that while we are above this support the market is in a trading range.

We also saw this week a higher high printed over the short-term; the prior swing high on this decline was the 1/29 close at 1,940. Tactically this makes way for a potential bottoming sign and a trade-able setup. Structurally however this longer timeframe remains with a lower bias. As you can see we have negative sloping 20/50 Week MA's that are crossed bearishly (falling 20 below falling 50) with a larger trend of lower lows and lower highs.

 Price is generally moving in a wide descending channel since 2015. There have been clusters of activity at each minor turning point. Each resolution of a cluster (a break through support/resistance) has offered minor trends for trading. With this week's breakout we may be seeing another of these opportunities. That doesn't take away from the fact that the larger trend remains down-sloping. To extrapolate forward, the next price "cluster" should likely occur near the resistance zone between 2080-2000. At that point we will see how the market behaves, but the pattern so far has been to resume lower after failing at resistance.

Keeping this broad context of how the market is generally behaving is very important. Understand that there can be trades to be made over the short-term, but that the longer-term direction for the market remains lower. This means Long trades are more likely to fail and position sizes should be reduced to account for the lower probability of success.

Our Large-Cap Portfolio is currently 30% invested: 25% Long PM, AEP, PCG, FB, GE. 5% Short CVS and GD. 70% Cash.

This is a very defensive posture with exception of the FB and GE holdings. Last week I began to leg into Short positions in CVS and GD as price entered key resistance areas. Should we receive further confirmation of weakness going forward, I will begin to increase the position size in these names. For now they remain test positions as the market has managed to show strength. 

FB
FB continues to be a solid holding, both structurally and tactically. While the SP500 makes a series lower high/lower lows, FB is making higher highs and higher lows. Should the market recover from here FB is poised to be a leader of a new uptrend. 

GE
GE remains wedged between its long-term breakout support and recent highs. A move below $28 would be seen as a negative and likely lead to a gap fill near $25. The longer the stock stays above $28 the better the likelihood that it reclaims 52-week highs. 

AEP
Utilities reversed solidly late in the week. This brief pullback comes after a 15% rally in the past couple months for AEP. It's possible a rounded bottom has formed and a "handle" type pullback over the next several weeks builds a new support base to rally from. 

PCG
The same can be said for PCG. Utes are in strong structural position, but may need some rest after the sharp rally higher. 

PM
It would not be unusual if PM consolidated above $90 here for a while. It remains in a market leadership role. Should the breakout fail we would exit below support at $86.

Short CVS 
CVS has returned to its Head/Shoulder breakdown point with momentum in a bearish range. The key level between $98-100 acted as support for 18-months and now is holding as resistance. We've seen a rally of nearly 15% over the past 3 weeks right back into all this supply. Price has been able to regain the 20 WMA, so there's a small victory for the bulls. But as long as CVS remains below $100 the risk is to the downside.

Short GD
GD is back to "the scene of the crime" from its January breakdown. GD has rallied $15/share in the last 6 weeks and is now bumped right against its declining 20 WMA. The band of overhead supply from $138-135 should provide a formidable battle for bulls to conquer. For now we will remain short below the weekly close from 12/24 at $139.85.

WATCHLIST- Long


MDT

HD

SHW

WATCHLIST- Short


BAC

GILD

UPS


Friday, February 19, 2016

So You Want To Be a Bull?

There has been a lot made of the recent bounce in the markets. The SP500 has rallied some 6% off the lows of last Thursday and has emboldened many to call the low for the year. The SP500 has defended support and squeezed some shorts. It has also coerced nervous, sidelined Bulls fearing missing out on any upside moves.

Active fund managers are holding large Cash positions and we are seeing sentiment extremes surpassing the 2003 or 2009 bear market lows:
Chart courtesy of @RyanDetrick

So the gist is investors are scared, active managers are highly defensive and the market has rallied sharply, quickly. Does any of this mean the lows are set? No it does not. Could the lows be in already? Sure they could. But how are you suppose to figure out what to listen to and how to position?

I'm gonna make this really easy for you: FB, AMZN, and GOOGL. This is all you need to focus on in the coming week to know if we are going to experience follow-through to the upside or if lower lows are coming next

These 3 stocks were among the true market leaders last year. Yet in 2016 they've been dumped and have led to the downside. These are your typical "risk-on", bull market growth stocks. For any lasting rally to stick we need to see money rotate into the more risk sensitive and offensive stocks. 

We interact with the markets in a series of "If/Then" propositions. If A happens, then we do this. If B happens, then we do that. Looking at the structure of these three on the short-term timeframes will tell us everything we need to know about the coming market direction.

FB 30 Minute Bars
IF: Facebook gaps higher and through $105 resistance, THEN: I will Buy FB for a trade with stops below $103.

IF: Facebook gaps lower and through $103 support, THEN: I will Sell/Short FB for a trade with stops above $105.


GOOGL
The same goes for GOOGL. For bullish bets I'm looking for a gap above the recent tight trading range from Friday. Clearing $723 gets me Long with stops below the swing low at $714.

If GOOGL gaps lower and through support at $714, then I will Sell GOOGL with stops above the consolidation at $723

AMZN
I'll swing Long AMZN with a breakout above the neckline resistance at $540.

SP500 
When I talk about "structure" I'm looking for momentum to hold a positive range, clearly defined swing highs and lows (resistance/support), followed by tight price action near a critical swing point.

The structure of the three stocks above and the SP500 resemble each other. They sit at an inflection point and we don't know which way they will break. If I'm putting my money down I want to be positioned in the leading issues. If the market is going to breakout, these stocks will do so harder and faster than the broad index. 

With leading stocks you get the clearest picture of what's happening due to their heightened sensitivity to general market movements. If this market is going to move higher out of this base formation, participants are going to bid up higher beta stocks with better growth prospects. Likewise if the market is going to resume its longer-term trend lower, any remaining "hopeful" investors are going to continue to dump higher risk, higher valuation issues.

This is what I mean when I say if you want to know how to position going forward all you have to do is react to whatever direction these three stocks tip. Generally they are going to follow the market and will do so in an aggressive way whether that's to the upside or downside.

Longer-term this market is in a downtrend, rallies are generally selling opportunities in downtrends. However if we do see an upside resolution that holds the key 1,950 level, a further and violent chase could be on.

Also realize these are short-term trades. I am not making long-term investment decisions based on this analysis. If this market is going to squeeze higher I want to participate in my aggressive trading accounts. I will be doing so through FB, GOOGL, and AMZN. However if these moves turn out to fail and we see pressure on the new trend, I will exit quickly.

Thanks for reading.
-ZT

Saturday, February 13, 2016

Banks Are Extended: Rally to Provide Selling Opportunity

When looking around the market, the major Financials look quite extended and could provide a relief bounce. To be clear however, this is a bounce in a downtrend and this rally (should it materialize) will be a selling opportunity.

This week I want to run through the $XLF Top 10 Sector Holdings and show you what I see. During the recent leg lower Financials have been the hardest hit sector. Names like $BAC, $C, and $AXP have been annihilated. Others like $GS, $AIG, and $JPM have come under duress as well.

Financials (XLF)
First lets look at the XLF. This chart shows the weekly prices of the Financial ETF since the 2007 market top. XLF is the only major S&P sector that did not recover to new highs in the recent bull market. This makes it the weakest of the major sectors and those are the places we like to target for potential short opportunities.

The XLF recovered to its 61.8 Fibonacci retracement and has since rolled to the downside. There is the chance we see a relief bounce soon, but ultimately there is very little support for the group until the $17 level. A rally from here will encounter stiff resistance near the $22-22.30 area. I will look to be a seller there. 

The sharpest rallies occur in bear market trends. The Banks are in this category now. These rallies are to be used to position short against. "Shorting into the hole" is what's referred to as taking a short position after a very sharp decline has occurred. Due to the tendency of fierce bear market rallies, shorting into the hole exposes you to the increased likelihood of being squeezed by a sharp rip. Its best to wait for the rally and position your short into a prior support, turned resistance. That way if the rally continues we can easily step aside, or if it ends at the resistance we stand to profit handsomely from the downtrend resuming in our desired direction. Risk/Reward is in our favor by waiting patiently for the setup to form.   

BAC
Bank of America is currently my favorite prospect in the market for a short position. For more than two years the stock has churned in a range between $18 and $15. Since the November high, BAC crashed $8/share down to $10 this past week, that's a 45% drop in two months. 

Seeing the volume that came in on this week's move I'm of the belief that a reversion trade is likely. The stock is trading 30% below its declining 20 WMA and is generally in a position to come back to that long-term average. 

The setup for this potential short entry will be on a sharp rally back into the prior support level at $15. This will require a 25% upward move and I expect that to take several weeks to complete. The time required will allow the declining 20 WMA to meet price near that area as well. We want to sell a rally into this confluence of resistance. 

C
Citi is very much in a similar position as BAC. The stock declined 45% from its recent high and is 30% below its declining 20 WMA. Like BAC, a substantial inflection level exists at the range lows near $46. This can be a great anchor point for new short positions. 

AXP
As you recall we held a short position in AXP from September through early January. The stock is in complete free-fall, recovering to $78 seems almost unfathomable. This will be a name to watch on a bounce, but the levels aren't quite as favorable as BAC and C above. 

GS
Goldman offers a nice clean level to short against as well. During 2015 GS built a textbook Head/Shoulder Top formation and confirmed the pattern on the January 8th breakdown. Since that break the stock has accelerated to the downside. Typically with these patterns we will see a throwback rally to the neckline support level, in this case $170-172. That will be a rally to fade should it materialize. 

AIG

JPM

WFC

USB

AIG, JPM, WFC, and USB all remain right near major support lows. Give or take a few percent these are still likely range bound. Range bound stocks don't make the best trend trades so I would avoid them for the purposes of our potential short positions. 

BRKB

SPG

BRKB and SPG remain the two strongest stocks in the XLF. Due to that fact we will avoid them for our short focus as well. 

We want to be short the weakest stocks in the weakest sectors. For our purposes the stocks to focus on out of this group are BAC, C, GS, and AXP. We have our defined levels to watch for and want to take action when the setup forms a strong risk/reward opportunity. 

It's also possible none of these setups form and we miss out on a trade. If that's the case, so be it. We wait for our pitch. There will always be another trade around the corner that fits our parameters. 

To show exactly what I look for in a short setup I want to review the Emerging Markets ETF EEM. 

EEM
Here is the Emerging Markets EFT EEM. The group traded mostly sideways for a few years, moving between $46 and $36. During the August decline EEM looked a lot like how BAC and C look currently. It declined from $44 down to $30 in a little over 3 months time, or -32%. 

At the low of its decline EEM was trading right around 30% below its declining 20 WMA. With the Fall recovery in the market, EEM was able to bounce back to the prior support level at $36 where it met its rapidly declining 20 WMA. This was the signal to take a short position with a stop loss placed anywhere near the $37-$39 area depending on your timeframe and risk tolerance. Once EEM rolled back over, confirming the resistance, stops could be quickly trailed to the entry point at $36. 

Depending on your strategy you could outright borrow shares to short or make the play via Put options. Personally I prefer using options to trade short positions for a few reasons. First I like defined risk. Part of the risk of shorting is the potential for unlimited risk should the trade move substantially against you. Since you borrow the shares, you owe your broker should anything adverse happen to your trade. This is not something I'm comfortable with. When using Put options you are only ever responsible for the premium you paid for the options. 

Secondly options trade with leverage. Once you define your total risk, the worst you can lose is 100% of your investment (although you should not let your Puts expire worthless, that's just poor management). But the potential gain due to the leveraged nature of options you can easily make 300, 500, or even exponentially more depending on how everything unfolds. Generally I shoot for a max loss of 50% of my premium and a typical gain of 200-300%. That amounts to a nearly 6-1 reward to risk. And occasionally gains can become much larger than that.

Lastly, options obtain their value from price of the stock, time until expiration, and volatility. When trading Put options, volatility tends to increase more rapidly on downside moves. Therefore your trade gains extra steam quickly should price begin to move strongly in your direction.

There are drawbacks to being Long options however as well. Often the stock can move in your desired direction, but due to the decay of the time factor, your trade will actually lose money even though you have been right in the general direction. This is also why I like to be more in and out with option trades. You want to jump in when prices are likely to accelerate quickly, but this is easier said than done. 

Whatever your preferred strategy just be sure you are taking on a risk you are able to withstand and stick to your discipline. Shorting stock is generally more difficult that being Long. The market tends to be in an upward trajectory roughly 75% of the time, so the odds are mostly against being short for a long period of time. When the market turns downward however there will often be opportunities to those who are watching closely and have a defined plan to execute from.

Thanks for reading
-ZT

Wednesday, February 10, 2016

Hurry Up and Crash?

I'm hearing a lot of frustration coming from traders on social media recently regarding the slow motion churn that is going on near major support levels for the market. Dip buyers are weak but present, short sellers are getting impatient, and sentiment studies say we need more fear.

The trends are pointing lower, yes. But the persistence that we need to just hurry up and crash are growing by the day. Participants say we need capitulation until a meaningful low can be set, they say substantial fear is lacking.

The consensus I am finding is how much in a hurry everyone is for this decline to resolve itself so we can all carry on with our normally scheduled market performance. I'm not a fan of market analogies, but if this decline is to become a substantial decline (which many feel it will) it may take a long time to play out. Take the 2008 Financial Crisis decline for example:

SP500 Top Formation 2007
 Looking at the 2007 market top I see many parallels to out current structure. This doesn't mean our current market has to implode like 2008, but we aren't ruling anything out. The SP500 took the entire year of 2007 to complete its top pattern. The breakdown began to tremor in November and then staged a bounce attempt into its then declining and crossing 20/50 Week MA's. The next leg lower broke the major support lows from August and November, beginning the first leg of the decline.

Our current position I believe resembles the January '08 follow through move. If this is anywhere close to being accurate, the insistence that we "get on with the plunge already" may lead to much more frustration going forward.

Most people's memory of the Financial Crisis was that of a sudden and dramatic event. Movies and financial media basically start with Lehman Brothers' bankruptcy at the end of September 2008, which then was followed by the two large declines the opening week of October and the subsequent week that ended 10/10/08. In reality however the downtrend was 9-10 months in the making by that time.

My point is that the most devastating decline to US stocks churned and gradually rolled lower over the course of a year before the real damage hit. Those expecting the current downtrend to be a one and done type of drop and pop may have a frustrating year ahead of them.

SP500 '08 churn and retest
Following the January breakdown we saw a substantial drop the next week. But for all intents and purposes the market continued to churn between 1300-1400 for 6-months. During this time dip buyers continued to plug away and were able to grind prices back to the January breakdown level, retesting prior support, turned resistance. Once that rally failed the S&P resumed lower but then dug in for another 3-months before the actual bottom dropped out.

If we look at our current market we can theorize a similar scenario. Again 2016 is nothing more than 2016, its not 2008 and no two market events are the same. But human behavior does tend to repeat, so we can work through a potential scenario where we don't just implode but rather grind and churn to most participant's displeasure.

SP500 Current Position with Similar Projection
 Here is our current market and rounded top pattern. Like the 2007 top, it formed over the period of a year +. We have seen the move confirm lower as the recent January/February declines have created a lower low beneath key support. Now everybody's itching for some fantastic implosion lower, but what if we get a rollover like early 2008?

I've drawn (crudely) a similar scenario to the post 2008 support failure. If the analogy plays along we could see prices hanging around current levels well into late summer or longer.

My intention is not to be highly complacent at this point. I'm not complacent, I'm a trend trader and intermediate trends are lower. I'm highly defensive in my posture and intend to stay that way until new setups form and trigger based on my signals. The intent of this post is to point out that every move in the market doesn't have to be some instant, dramatic event that scars us for life.

Sometimes markets decline. Sometimes they decline a little and sometimes they decline a lot. Our job is to focus on what's in front of us and attempt not to develop biases to what we think should or will play out. We need to remain open-minded to a recovery in stocks from here. We need to remain open-minded to an epic crash unfolding next week. And we also need to remain open-minded that maybe we just chop in a relentless, brain battering trading range for years to come. 

The main point is none of us know what's coming next and the market owes us nothing. It will do as it pleases and we need to be prepared for whatever path that may be. 

Thanks for reading 
-ZT

Saturday, February 6, 2016

Bad Spot

Despite two positive weeks to end January, February started off with a flop. The SP500 declined 3% on the week and while we have preached caution it seemed some kind of relief could have been ahead. Of course its always possible we turn and rip from here, but the current posture puts us in a bad spot.

SP500 Weekly Line Chart
I like to look at line charts often. They take much of the noisy price movements out of the equation as they only reflect closing prices. As Charles Dow always suggested, closing prices matter the most.

When looking at the weekly closing prices of the SP500 we can see that the market ran right into resistance at the prior support level from the August and September lows. Last week's bounce came right into that level and this week rejected it for lower prices.

When looking around the market maybe we get a good shakeout next week and then see a bounce. Its just that so many groups are very extended to the downside. It should be stated though that markets generally crash from already oversold levels.

Weighing the market scenarios, we have to consider that while there could be a relief bounce to somewhere near the declining 20 WMA (2,0000), the chance that stocks completely fall out of bed from here is very possible as well. It appears many market participants have been expecting a rally and have positioned for it (considering the dip buying that occurred at the end of January). Last week's selloff has seemingly caught the "oversold" buyers by surprise. When these setups fail, they can fail spectacularly.

I always like to say that bad things tend to happen below a declining 20 WMA. Its not that they have to occur, but when they do it tends to come from already weakened conditions. These conditions exist right now. It doesn't mean we are doomed to collapse, but if we did it shouldn't catch anyone by surprise.

There was heavy selling in the high growth names this past week; the famous F-A-N-G stocks saw large downside moves. There were also some tremendous beatings done to some prior bull market darlings after they reported earnings. I want to take a look at some of these and see what damage was actually done.

Amazon (AMZN)
Amazon has declined more than $200 in 6-weeks. After the seemingly endless rally of 2015 it is now  working on a correction. I drew the Fibonacci protections of the previous rally and it appears we will test the 50% retracement and possibly down to the 61.8 Golden Ratio retracement. The Relative Strength trend also broke this week as AMZN declined 14.5%, well outpacing the general market. For now this stock is broken and we need to give it room to rebuild support and heal its trend. 


Google (GOOGL)
Google announced strong earnings this week but saw that announcement sold. The stock formed what is called a bearish engulfing bar and outside reversal pattern. This is where the stock makes a higher high and then closes below the entire range of the previous bar. Volume on the move was extremely high and I see this pulling back or consolidating more going forward.


Netflix (NFLX)
NFLX was a huge winner in 2015 but over the course of the last 9-weeks has declined -38%. I received exit signals in my Growth portfolios on 1/15 and the skid since has been relentless. This appears to be another broken stock that will need much repair before it finds itself on my radar again.
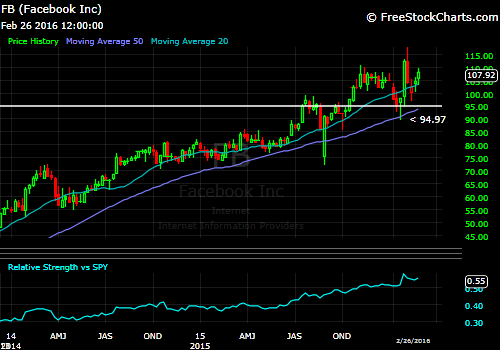
Facebook (FB)
FB is the one FANG stock holding up quite well. This week wasn't ideal but it remains above a rising 20 WMA and in a steady uptrend vs the SP500. Our stops are trailed to the 94.97 swing low and will remain holders above that level.

LinkedIn (LNKD)
Now we get into the fun stuff. LNKD has been a very volatile name since its IPO rally of 300% from 2011. The stock has traded between a range of $275 and $140 for the better part of 3-years. This week however blew any hopeful longs out of the water by declining -43% on Friday after reporting earnings on Thursday afternoon. Just to be clear, you don't see moves like this in healthy markets. While the market has been stressed for some time, the moves we saw this past week reek of massive liquidations and a bear market environment.  


Tableau Software (DATA)
DATA was another epic meltdown this week. They too reported earnings and received a -50% haircut as a result. Again, moves you don't see in healthy markets.

This stock is a great example of how following trends and price action protects your account from massive, life altering losses. DATA traded in a beautiful uptrend from the middle of 2014 through summer of last year. I owned this stock within that period but was stopped out rather violently on 7/31/15 when the market was not pleased with their earnings. This is generally how trends go, when they're done, they're done. There is little to be gained hanging around hoping for them to recover. Its best to step aside and reenter if/when it resumes a new uptrend.

Also you can see that except for the initial shock (7/31) all of this damaged has occurred with the stock trading below a declining 20 WMA. I hate to say it, but anyone holding this name into this last week had this coming. Maybe they didn't understand the degree of risk they were taking, but this comes from an inability to read the market and detach emotions from positions. There was just absolutely no reason to have been long this stock into this week's announcement.

Salesforce.com (CRM)
CRM is another example of a trend ending and the fallout that usually comes. Since its failed breakout and 20 WMA violation (Growth accounts took exits on 1/8) its gone on to decline another -20% from our exit and -30% off its all-time high back in November.

This week the stock dropped -14%. When its over, its over.

Linn Energy (LINE)
I wanted to show this example of Linn Energy. This stock is one I owned for much of 2012 when it was trading in the mid-$30's and $40's. I exited in December of 2012 as it began to break trend and weaken. At the time the company paid a dividend of 7.5%; there seemed to be little risk holding a position in LINE. The stock was stable, growing and paying a hefty yield just for owning shares.

However like all seemingly "sure" investments, conditions can change very quickly. Fast forward 4-years and the stock has lost more than 95% of its value and the dividend no longer exists. The first lesson here is that regardless of how something seemed in the past, the future is always uncertain. This is why acknowledging trend and risk management is out top priority. Only price pays, price has to be our primary focus. The other side of acknowledging trend and price is ignoring noise from financial media and especially from company executives. Here is the press release from Linn Energy's CEO following Friday's 58% decline:

"Efficient management of our stable asset base and aggressive cost management are driving meaningful value even in today's difficult commodity price environment," said Mark E. Ellis, Chairman, President and Chief Executive Officer. "However, given commodity pricing pressure and the impact that market challenges are expected to have on our industry and the long-term financial outlook of our Company, we believe it is prudent to explore opportunities to strengthen our balance sheet and ensure we have adequate financial flexibility to manage through prolonged commodity price headwinds. By proactively undertaking this process now with the help of our advisors, we believe we can implement a comprehensive solution that will position LINN for long-term success."

Ellis continued, "We have a very talented workforce, and I am proud of everything that this team has been able to accomplish. We currently have adequate resources to continue the efficient operations of our assets with the support of all our vendors, suppliers and partners while we work through these strategic alternatives."

This is just complete and absolute bullshit. Company executives never come out in a press release saying their stock is garbage and shareholders should run for the hills. NEVER take what you hear from a corporate executive as trustworthy or actionable information. Also note this comment is coming when the stock that just the day before was trading barely over $1. Yeah real "stable asset base" and "driving meaningful value". Classic. 

The second lesson is that even when a stock looks to be too cheap that it can't possibly go any lower, it can. I've heard many times recently how the price of a stock is so small that its a great value. I want to impress on you that "small" and "cheap" are not the same thing. Just because a stock is trading at $1 doesn't mean it can't go lower. As we saw with LINE above, a decline from $1 to $0.50 is exactly the same as a stock trading at $100 and falling to $50. There is no difference in the loss your account suffers in that event. Remember that all stocks that go to zero, and there are a lot of them, all traded at $1 before going bankrupt.


The bottom line this week is to remain very cautious. This market is acting in a way that most new investors have never seen. When the only stocks leading the market are Utilities, Cigarettes, and Consumer Goods companies, there is a problem. When high growth stocks, those that have been leaders of the entire bull market, begin taking massive losses and warning of forward guidance...There is a problem.

We are in a bad spot currently and much will have to be repaired to create viable trade candidates going forward.

Thanks for reading
-ZT