NASDAQ COMP (weekly)

SP500 (weekly)

Historically, declining leadership in the underlying stocks is bearish for the market and is a notable symptom of major market tops. Keep in mind I'm not calling for an end to the bull market yet, but do know as fewer and fewer stocks participate in the uptrend it is more likely to come under significant pressure.
The way I view declining leadership is there are simply less viable options for new entries. This helps protect capital as no new risk is taken because more positions are stopping out than are triggering new buy signals. The Rotation method of investing that we deploy follows the strength in the market; we try to only own the strongest names and avoid the weakest. This keeps us only taking on new risk when strength improves and more new buy opportunities present themselves. Almost all of our current holdings are among the 30 SP500 stocks trading above their 20 WMA's. We did see a couple of our holdings fall below that trailing support this week, but still remain above our stop levels for now.
We had no changes to our Lg-Cap Portfolio but do have some holdings we need to take a closer look at as they are showing vulnerability.
AAPL

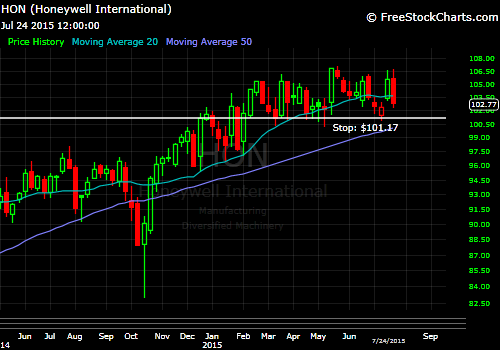
HON
BMY

We will stick with this for a while longer as $63 is providing strong support and we have substantial gains in this name. When you have strong profits in a stock the prudent thing to do is let it run. You win in investing by having small losses and a few big gains. The only way a stock can create a big gain is if you are able to be patient with a winner and simply let it happen. That is where we sit with BMY. With our current stop placement near $63 we have basically assured ourselves of a 20% gain should we stop out from here. This is where being patient and sitting on your hands is the best course of action.
UNH

After those 4, we are still left with 9 outperforming stocks and a few of those actually closed higher this week despite the -2.2% decline for the SP500.
SBUX

With earnings out of the way we can safely slide our stops up to the prior swing highs and 20 WMA at about 51.50. A pullback would not surprise me considering the recent run this has made, but I would think it would be less than the 10% cushion we are now giving the stock. Again this is a big winner for us and we can certainly give it room to find a new support base.
FB

They will announce earnings this week Wednesday after the close. After the announcement, should the stock hold up well, we can then trail stops to near the $84 level. But I want to give this plenty of room heading into earnings as the recent performance has hinted at the potential future upside.
For those that like to use options, this current setup is an interesting place to buy some OTM puts down around our $78 stop level. For example our position sits on a +17% gain heading into earnings this coming week. Should earnings be poor (and especially considering the recent ramp in the stock) a sudden correction could wipe out most of our hard earned profits.
A possible strategy to protect our position would be to buy the 77.50 Sept 18 puts for about $.65. You could for example buy 5 contracts (.65 x 5 = 3.25 or $325) and have downside protection through our stop level. With open gains near $2000 for our Portfolio, a $325 hedge in the event of an unexpected shock could be well worth while. Just another idea to consider. ( Full disclosure I will be looking at these puts heading into ER Wednesday morning)
DIS
 DIS continues to be relentless. Not much more to say than that. Impressive. Stops remain at the consolidation lows near $107.65.
The remaining holdings are still in longer term uptrends but did show weakness along with the broader market this week.
GILD
 GILD will announce earnings Tuesday after the close and currently sits right on top of its prior trading range. The overall action remains constructive even though this week's bar was quite lousy for the short term. Our stops remain below the swing low at 103.85 and would require a full breakout reversal to stop us out.
TWX
 While we certainly dont like to see a new breakout sold in the manner as TWX was this week, it is also important to realize that price is still retesting the upper range and prior highs. This remains an outperforming position as the stock is still above both the 50 DMA and the 20 WMA (shown above), while the SP500 is trading below its key MA's. The trend of higher highs and higher lows is still intact and I see no reason to get over-anxious as long as the stock can hold above the $83 range lows.
WFC
 We can trail stops in WFC to the prior highs and recent retest area. After setting new all-time highs in back to back weeks, the broad market selling took its toll on WFC at the end of the week. But it still remains a relative leader and as long as it can hold above its breakout area we will be happy to let this one run.
AIG
 AIG continues to press multi-year highs and is still unwilling to give back its recent gains. I expect some sort of consolidation soon, but for now we can tighten stops to the lowest close in the last 10 weeks as well as the prior consolidation range just above $58. We are giving this plenty of room, but at this point it's not given us reason to doubt it.
GS

DIS

The remaining holdings are still in longer term uptrends but did show weakness along with the broader market this week.
GILD

TWX

WFC

AIG

GS

Goldman still remains in breakout mode longer term but in a shorter term pullback. It remains a solid out performer on the weekly timeframe as it sits well above its rising 20 WMA. Should GS find its footing here soon we would have a new level to trail stops to, but we will need to see a resumption to new highs before that can happen. For now we will just let it continue to consolidate above its prior range highs.
The market continues to churn at ATH's and many remain convinced an imminent and violent decline is just ahead of us. Maybe it is, maybe it isn't. There's really not any way to know for sure. While there are certainly some early warning signs present, our leading stocks continue to hold their longer term uptrends and breakouts. I prefer to let the leading stocks tell me how to position my funds and while more stocks are breaking trends, many still look strong. Stay alert out there and be sure to check in for any changes during the week @ZenTrends on Stocktwits and Twitter.


