As we know from historical study, markets often telegraph turns in economic conditions well ahead of mainstream evidence being made available. Prices will top out on the best news possible and bottom on the worst. When the conventional opinion is leaning one direction, the market begins to tip the opposite. It is up to us to see through the noise and listen to what the market is really telling us.
This brings me to the 10-year Treasury Yield (TNX)
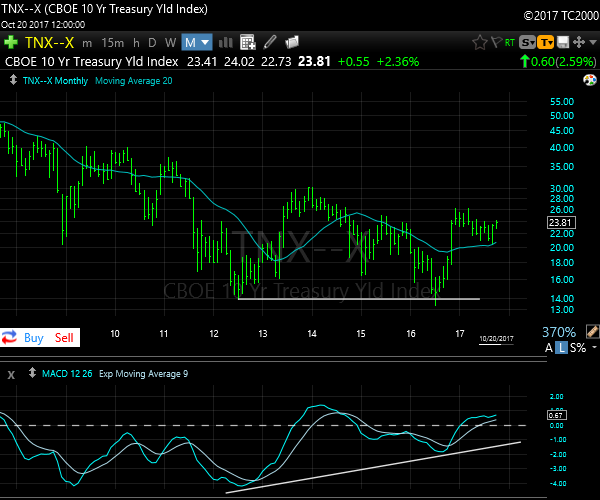
Note that momentum was much higher on the 2016 low compared to the 2012 low, creating a strong positive divergence. Since the beginning of the year Rates have consolidated orderly and have formed a Bull Flag pattern into the now rising 20 Month SMA. Regardless of the asset class, this is my bread-and-butter setup and has led to many monster upside moves over the years for me.
From a price and momentum structure this is what I would call a multi-year Double Bottom pattern. Often it is suggestive of major lows being set and very strong price recoveries ahead.
I want to look at the structure of momentum by itself as well.

If we look at this chart it shows us only one time in the last 40-years when Rates were in a sustained uptrend (1975-1982). The rest of the time momentum has been < Zero and only breaching the line for very brief periods before retreating once again. This is downtrending behavior.
It should be noted that the activity over the past few years has been changing from the previous pattern. At no point in the last 30-years has the indicator been able to move > Zero and then sustain above the line. Each attempt to get above Zero was then followed by at least 5-years of action back below Zero.
However, the most recent movement has recovered Zero within 2-years of the prior visit. The pattern appears to be changing for the first time in its observable history. The more time momentum can hold above Zero, the more confidence we can have in this thesis.
So how do we make money based on this theory? If Rates are going to increase steadily over time, what will be the primary beneficiary of the change in trend?
In my view it is Bonds that will suffer the most, while Bank stocks and especially the Regional Bank stocks, set-up to benefit the most.

KRE Regional Banks

These formations are a decade long or more and have only made new highs within the past year. Typically the length and size of the base gives an indication to the length and upside potential of the price trend to follow.
As the saying goes, "the bigger the base, the higher the move in space". In the examples above, JPM has been building a 17-year horizontal base pattern. Regional Banks have been in the process of emerging from an 11-year base of their own. The upside that can come from these formations we know from studying the great winners of the past. In my experience and study, these are some of the highest probability structures to focus long-term positions on, and we have been doing so.
Members of zentrendstrading.com have been receiving alerts and position management education in the above names as well as others in this space. If these trends can persist we may be establishing positions that last for the next decade or more. Just this week the Regional Bank space is offering yet another opportunity to participate in the blooming trend.
If this is something you would like to learn more about please contact me @ZenTrends on Twitter or visit our website.


