In hindsight the market ripped straight up on Wednesday and Thursday and ended up with many stocks holding just above key stop levels. Had I not made that adjustment we would still be long those 4 names. Its possible I made an over reactive move and altered my plan's rules in an emotional moment. And that reaction likely caused me to exit our holdings prematurely. But by having watched what transpired Monday morning with SBUX, UNH, FB and HD plunging more than 15% in the first 5 minutes of trading, I made the call to limit exposure as quickly and reasonably as possible.
My #1 rule is capital preservation and managing risk. Trader Mark Minervini summed that concept up well this week on Twitter:
"My main concern is managing risk. The minute I think I can't effectively control risk, I step aside." -@markminervini
Here is a look at SBUX's trading range this week:

From the close on Friday SBUX declined 20% in the first 5 minutes of trading Monday morning. It then managed to surge higher and close Monday down only 4%. The rest of the week it rallied back above key support.
While it's disappointing that we exited at Monday's close, the alteration of this trend is notable. This week was the largest trading range from high to low since October of 2008, in the heart of the financial crisis. Seeing action like this doesn't encourage me to put my money on the line here. Maybe that was the low and maybe the stock just rips back to all-time highs, but as of now I have lost the ability to manage risk due to such a wide trading range.
The market rallied strongly over the last couple days, recovering 115 points from Tuesday's low. It appears to me that many are quite complacent with the "correction being over" and that we will just recover right back to highs. While the price action shows a buy the dip mentality, the longer-term trends have come under severe pressure.
SP500 Daily Chart

We want to keep an open mind and be ready for any possibility, but the path of least resistance appears lower. As important support levels are broken, they then become resistance on the way back up. The first level of support turned resistance is 1990 from the trading support in December and January. That range resolved to the upside and from March until mid-August held on pullbacks to 2040. 2040 is likely to be the toughest area should the market return to that level.
It often takes multiple attempts to break through overhead resistance as each attempt draws out more and more sellers. This is why after substantial technical damage a "base" will form. We will need to see the market establish a floor of support on the next pullback before we can manage risk appropriately. A sling shot off an emotional low is rarely the end of a move. Often those lows will be retested to see if the buying interest the first time was genuine. This new floor of support is what will provide the fuel to eventually launch the market back through overhead resistance levels.
Until we see this "support floor" in place we simply need to be patient and protect our capital. I know its painful watching the market rally without you, but we manage risk here. We don't try to catch every tick in the SP500. The idea is to get your money in when the odds are in your favor and protect it when they aren't. Don't worry, you won't miss the market. When the setups are in place for strong risk/reward investments we will receive new entry signals.
This week I want to take a look at some broad market measures of intermediate and long-term trend health, just to see where we sit and how much damage was actually done under the surface.
SP500 SMA's

We last saw this formation in 2011 and 2008, when the moving averages were sloping down together. This isn't always a sign of big trouble, but when this formation is in place it suggests the trends on multiple time frames are pointed down and risk becomes elevated.
Monthly Bear Market Signal

Currently 2 out of 3 signals suggest a trend change and the remaining signal (likely the most important) has price sitting right at its 20 MMA. This Monday 8/31 will be the last trading day of the monthly bar. The SP500 will need to gain 4 points on Monday or this signal will be valid.
There have been 3 Bear Market signals in the last 15 years:
1. November 2000 led to a 23-month correction and -41% further decline
2. January 2008 led to a 14-month correction and -51% further decline
3. September 2001 led to a low being set the next month and -5% below the signal close
The first two are legendary signals as they avoided more than 80% of the downside in two of the worst bear markets in history. The third signal in 2011 proved to trigger one month before the low of the decline and then kick started the 3-year bull market that is currently in motion.
Looking back as far as 1977 there have been 5 other occurrences of this signal:
1. May 1977 led to a 14-month correction and -10% further decline
2. August 1981 led to a 12-month correction and -18% further decline
3. May 1984 led to a 2-month consolidation with no further downside
4. October 1987 the real "Black Monday" triggered this signal. It only lasted 2 months but another -12% of downside followed
5. August 1990 led to a 2-month correction and -8% further downside
Going back to 1977 I count 8 signal events and NONE of the signals set the low for the correction. Some were certainly worse than others, but the point is the signal never marked the absolute low. On the bright side EVERY signal eventually led to substantial uptrends once the decline ran its course.
It should go without saying this is a signal to be heeded. Monday's close will be the signal day, so I will be watching close and update followers to its status.
SPX Weekly Timeframe

Take a look at momentum for the Weekly timeframe going back to early 2008.. Here are the times when momentum and trend (as measured by MACD) broke below the zero line:

7/2/10 marked the low of the 2010 correction
8/5/11 triggered on the breakdown of the 2011 market correction
8/21/15 signaled two weeks ago prior to this Monday's event
While the results for this signal are not very conclusive, it should be noted in the 3 previous occasions each required multiple weeks of base building and consolidation before developing any sustainable upside action. When the trend is damaged in this way it takes time to work off the signal.
VIX > 20

As you can see in the chart above that in late 2007 the VIX moved above and mostly stayed above 20 well in advance to the major market meltdown in 2008-2009. It has traded mostly below 20 since mid-2012 through this recent leg of the bull market. The last two weeks saw a strong move above the 20 level. Now the question becomes does the trend now shift to remaining above the 20 level similar to 2007, or does it slip back below 20 and the bull market resumes?
This will be one to keep an eye on as we go forward.
Just in case the rally the last few days has you feeling overly bullish or impatiently left out, here's a reminder the environment we continue to be in:
Ulta Salon (ULTA)

I have been seeing this behavior a lot recently, especially the last two quarters. Companies that are producing strong numbers are being sold on the announcements or shortly after. This behavior is typical of a distribution phase as large funds unload positions into the liquidity caused by the euphoric buying event.
This is NOT a symptom of growing, healthy markets. It is a symptom of an aging trend and lessened demand from big investors. When big investors sell is when markets correct and trends change. The "sell into strength" trend has been bothering me for some time. How many times did we see it this quarter? DIS, AAPL, SBUX, AMGN, GILD just to name a few. When the strongest companies reporting the strongest numbers cannot rally, its a sign of caution that should not be ignored.
Watchlist
Are there any names setting up within our Large-Cap universe? The pickings are slim but here are a couple we will be watching:FB

DHR

LMT

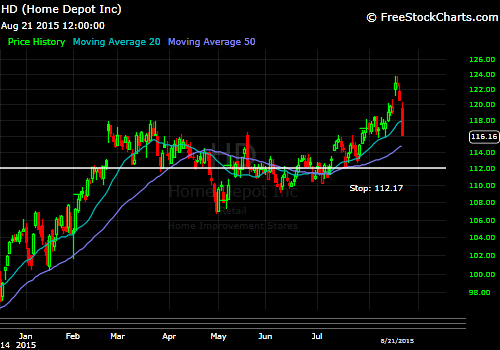
HD

Honestly this is as good as it gets in our Sector Top 10 universe of stocks. The few most promising setups are failed breakouts trading within their prior ranges. That's not encouraging.
Out of 90 total stocks we watch for this portfolio only 11 are currently trading above their 20 WMA's. Some of the stronger names out there are simply too loose now due to this week's wide trading range that it makes a high probability setup almost impossible to find. We have no choice but to watch how this plays out over the next several weeks. Once a new floor of support is built, then many new setups will begin to take shape.
Thanks for reading
-ZT