Wednesday, July 30, 2014

Exits Need to be Simple

There is something that goes on inside everyone's head when they sell a stock. That something is usually a combination of concern, doubt, greed, pleasure, and fear. When you buy a stock its mostly an excited reaction, much like placing a bet in a casino. Your heart may start to thump a bit and you will gladly watch the movement of your bet up and down. But when you sell, it doesn't matter if you are a winner on the trade or not. You will still wonder what if it keeps going up? What if I am selling at the bottom and its about ready to rally back? What if my indicators are not sending me a clear message?

This gets at the very heart of what I mean when I say your exits need to be SIMPLE. The less indicators you have the better, the less wiggle room you have to keep the trade on the better. Indicators can always be interpreted differently depending on your current bias. This is why I am instituting a "no indicators for exits" rule with my trades going forward. It is frankly to easy to convince yourself of not taking action when you use indicators for exiting trades. The only thing you should use for exiting trades is price.

If you have conflicting signals from price and your indicators, you will end up siding with your emotions and choosing to follow which ever sign fits your narrative best. If you want to be successful managing your own and other people's money you have to be able to remove the emotional element to trades and operate from a clear frame of mind.  Price is as clear as anything can get in an uncertain market environment. Its either in an uptrend, downtrend, or sideways trend. You then find the point where the current trend becomes invalidated and that is where you place your stop. If price closes below that level, the trend has changed and its time to step aside. Simple and no room for emotional interpretation.


The position that is stirring these thoughts in me is CMI with today's earnings gap down to begin the week of trading. I'll do my best to take you through my thought process here and why I am making this slight, but important change to my exit plan.


As you know by now the primary indicators I use to watch stocks are the Relative Strength ratio trend, 20 week moving average, Bollinger Bands, and occasionally when I wish to confuse myself more I will glance at the weekly MACD reading. The problem becomes when I am determining where I will exit the trade, I will wish to see all these indicators line up for a confirming signal. The problem is most signals trigger at slightly different times than others. That will confuse you on when is the right time to exit the stock.

Looking at CMI above (granted its mid-week, so this weekly bar has a lot of work still to do) you can see that slice through the 20 WMA and the gap lower that appears to break my RS trend support just as it did in late January. Based on this current view the stock looks like a clear sell at the close of the week. But then I saw that I could draw the same chart like this and tell a different story:

 From this angle if you incorporate the little RS break in January with the "revised" trend support, the ratio is simply pulling back to the line. When looking at price, instead of the toppy action in the first chart, this looks like just random movement within the uptrend channel with support at $140. Plus you can see over the past few years that each time the 20 WMA was broken it was broken violently and ended up reversing shortly after. So using the 20 WMA as a confirmation here is not a very accurate representation of the price movement and trend.

Seeing what a mess the conflicting indications around price suggest, we need to find a way to simplify the decision while still being fair to the dominant action in the stock. So what we need to do is step back, clean this chart up and focus on the only thing that matters, price.

Looking at the last 10 years of weekly bars you can clearly see a strong trending stock. The only thing to worry about in this view is that it has gone up too much...Whats the most bullish thing a stock can do? Oh yeah, continue to make new highs. Guess you have to chalk this one up to the bulls.

Zooming in on the last 5 years there was an orderly and substantial uptrend from 2009-2011. Price then traded in a sideways range for the better part of 3 years. We are once again moving away from the digestion area and seem to be resuming the prior trend. I would say another win for the bulls.

Now looking at our current situation price is in a strong established uptrend channel, with a very defined breakout-retest support area just near the channel support.
 What is interesting here is that once you remove the bias causing indicators, the derivatives of price, you are left with the true representation of supply and demand. And thats what this all comes back to, where are the buys and sellers in this market? If you are following price and trend its hard to argue with this clean of setup and channel. I think the prudent exit strategy here is to find the area where you know your trend is invalidated. That point to me would be below the support zone AND coincide with a failure of the 2-year uptrend channel. Call it $139 for now.

Due to the strong nature of this uptrend I believe I was getting a bit ahead of myself with my trailing stops. I was letting the indicators extend me from the actual levels of support and resistance, from trend invalidation. I was being led away from the bigger picture in this stock and was continuing to focus too much attention on the short term.

So here is the updated exit strategy with CMI:

 I still value my indicators, but when it comes down to pulling that sell trigger you simply have to put them aside and focus on what single element ultimately determines your fate in the trade. That simple factor is price; if price goes up I make money, if it goes down I lose money.

I feel strongly that indicators have an important place for trade entry as a confluence of indicators can confirm a price move, suggesting a very high probability of success. If you get conflicting signals, you can simply pass on that trade and look for a cleaner setup. But when you are already in a trade you cannot be dismissing a signal here or there and just decide that since they all don't agree that we will just continue to ride the sinking ship until they align. You could lose a lot of money that way and you simply don't have the luxury of non-action when you are in a live position.

Keeping it as simple as possible for position exits is very important to our success as investors. Avoid emotions, see the stop clearly, and execute once the trend is invalidated. Often we need to remind ourselves of these things as the markets are constantly evolving and changing, we need to remain nimble as well.

Monday, July 28, 2014

Knowing the Rules

Do you know the rules to the game you are playing? This isn't house rules Monopoly we're squaring off in, this is real life and real life has consequences. I hear it all the time that "the markets are rigged" and "its like a Vegas casino", etc. Put your hand up if you think shady transactions take place on Wall Street daily (hands all raised). Its no secret that insider trading, tips, and high frequency trading throw off the normal balance of the market. But if you understand that these things are going on and know how to identify and react when they are happening, it can take you from a hapless victim and turn you into a successful navigator.

The Slam and Grab

Let's take a look at one of our newest holdings, IP for an example of how understanding the "rules within the rules" can be important.


On the surface IP broke out of a 1-year sideways digestion of the previous rally, seemingly resuming the previous uptrend. Price had moved quite strongly leading up to this breakout leaving many "value" investors in the dust. As a general rule most people like to buy into weakness, not strength, but IP was not providing that comfortable opportunity to buy weakness. It was running away from them and their comfort zone. 

Where this gets interesting is when you look at what has happened outside of the price trends over the past month. Since breaking out of this range, IP has received 3 analyst downgrades. The first two were merely shrugged off but the most recent one acted like the straw that broke the camel's back and shares took a tumble. Again, on the surface this had the look of a failed breakout attempt and a scary looking "island top" pattern. If price wouldn't come down naturally someone decided to MAKE it come down. 

But a funny thing happened, once price reacted lower and saw a follow through down day (this is bearish confirmation of the negative price action = double scary) someone who likely missed out and wanted to get in bought a ton of the stock and sent it rocketing over the next two days. I call this the slam and grab technique. It happens all the time where a firm will downgrade a stock and after the initial price shock, big buyers will step in and accumulate the shares at the discount price. Often this is considered as a ploy to allow a big player to establish a position when otherwise would have been much more expensive to do so. This is the opposite of "pump and dump", which is a widely illegal form of stock manipulation. Basically someone owns a very large position in a stock and convinces a lot of other people to buy into the company, and once they are in and have pushed prices significantly higher, the original buyer unloads his shares at a sharp gain leaving the others holding the bag. The slam and grab is a way to force a hot moving stock lower so big investors can buy in cheaper before the stock makes another strong run. 

If you were ignorant to this type of manipulation you may have been confounded by the short term failed breakout signal and could have panic sold. But if you understand how these ulterior motives work you would have seen it for what it was, a strategic shakeout move, and would have maintained the proper positioning to stay with the holding. This is once again another reason why we like to take a slightly longer term view of our stocks and are willing to let our trades play out to the predetermined stops. But it's an interesting development none the less. 


Entering Verizon Communications (VZ)


VZ has been on my radar and held in other portfolios I manage for several weeks now, but this week we saw some significant trend development that has triggered an entry for our Portfolio. 

Price has completed a double bottom formation by taking out the prior peak from November and it looks like the prior uptrend is resuming in full force.


 As you can see from the longer term chart that after the torrid rally in 2012, the stock spent most of 2013 consolidating that extended move. Looking at this view you can also see the rounding bottom/cup pattern that triggered and we are now seeing the bullish follow through of that pattern trigger. There is so much to like here on multiple timeframes that it is one of my favorite setups moving forward. Based on the length of the rounded bottom, this could have multi-year upside potential. Also don't forget Verizon pays nearly a 5% dividend. 

For risk management purposes we want to be in this trade above 48.50. That is the prior swing low point and would suggest quite a breakdown from the current positive price action. 

For those concerned about the health of the overall market here, note that VZ only carries a .15 correlation to the SP500 since the middle of last year and has proven recently to perform strongly when the market struggles. 


Entering Enbridge (ENB)


For those who have followed the blog since the beginning know that I love ENB, and how can you not? Just look at that long term uptrend! In my view ENB is carving out a solid 5-wave uptrend, this recent high marking the trigger of the final wave 5 surge. The last third of a move usually is the place where the most money is made in the shortest time, but really this setup has multi-year potential. 


Recently though Enbridge has setup very strongly off of a solid support base. The recent trading action has the look of a continuation cup formation and projects an initial target of about $57. We have a very solid risk reward with this trade as well; we can use the swing low just below this breakout as our stop, call it 46.30 for now. This would require a failure of the recent breakout and a break of the rising 20 WMA and a lower low in the intermediate trend, that would be enough for us to step aside. 

I love ENB above those lows and think this could continue to be a big winner.

  Using Pullbacks/Corrections to Your Advantage

Everybody warns about a looming pullback. There is never a shortage of advice on how to protect your portfolio from pullbacks or corrections. But do you need to "protect" your portfolio from the wiggles in the market?

If you place affective stops and have a robust exit strategy, that is your protection right there. There is this feeling that pullbacks are to be feared and avoided at all cost, fortunes are lost trying to catch every move in the market. Not only do you drive yourself crazy trying to pick every top, but you are missing a huge hint from the market by being caught up in the noisy madness.

The hint the market offers you during a pullback is it shows you exactly what is vulnerable in your portfolio and where the real strength is. A pullback will take out your weakest holdings and only the best will remain for the next bounce attempt. This is another reason why I prefer to buy strength instead of weakness. If you are just lunging at every dip in the market and adding to the positions hit the hardest, you are growing your investment in a weakening stock. Successful portfolio management lets the pullback stop-out the laggards and once the dip subsides, the strongest stocks will begin to trigger trend resumption moves....That is where you should be buying.

The primary reason pullbacks are feared is because initially there is no difference from a standard small dip and an economically depressing market crash. Most pullbacks don't turn into crashes but being able to figure that out after the first 5% decline is impossible. However if you wait for the pullback to subside your probability of success increases dramatically.

A good rule of thumb is to monitor your portfolio and observe how your strongest and oldest holdings tend to make their way to the top of the "total market value" column in your account. This happens as your weaker and lagging holdings move toward the bottom. Then as the stops trigger, you cut off the weakest near the bottom and your remaining positions should continue moving higher in your account. What this creates is a situation where your best/strongest holdings are also your largest positions as they have continued to grow in value over time and you likely have had many opportunities to add to those winning positions, as we discussed above. And your lagging positions are your smallest holdings and then inevitably get cut.

This is a staple of Relative Strength investing and an easy way to make sure your portfolio is compounding positive returns instead of negative returns. You don't have to fear a correction, just allow the market to tell you what is good and what isn't, and continue to focus on what is good. This methodology will keep you on the correct side of the market in any environment.

My data suggests we could see a pullback very soon from current levels. The reason I bring this up now is so you can prepare your stop levels and watch how using this strategy can play out in real time. We don't want to sell early in anticipation of a pullback, but we also want to make sure we are listening to what the market is telling us. By triggering some stops it tells us that those stocks are no longer in favor and we should be focusing our funds in the remaining holdings that survived the correction. Run your winners and cut your losers.


Monday, July 21, 2014

Using Monthly Charts to Find Relative Value

Money flows in and money flows out, this is the way of financial markets. There is simply too much cash invested with big funds to have it sit idle on the sidelines. That money has to be put to work (in fact there are rules for how much cash can be set aside with many large mutual/hedge funds). They have to put it somewhere and that's where rotation between sectors and asset classes comes in.

Being able to identify where the money is beginning to flow in and out can be hugely beneficial for your investment success. But how does one go about finding the Relative Value in the markets at any given time? For shorter term trades using a Relative Strength trend can be helpful. But for longer term value identification I like to compare each sector group and individual stocks to each other and see what appears near base support and what appears extended from prior bases. This is where using a long-term, Monthly bar chart with a key moving average can be the best course of action. 

I was doing my bi-annual trade journal review recently and saw that at the end of 2013 I had written some ideas for relative value and relative extension in some key sectors and stocks. Using the longer term charts I am able to identify when something is "cheap" and recently out of favor and also when something is "expensive" and too much in favor. We want to position ourselves into the cheaper groups just when they start to see rotation coming back in and I highlight those groups with a simple monthly scan of the sector stocks. 

For example at the end of 2013 I was relatively concerned about Financials and Consumer Discretionary stocks as a whole. And I was relatively optimistic about Tech, Energy and Consumer Staples. These all played out nicely and now it's time to revisit where we currently are and what looks relatively good and bad.

To me it looks like these groups have basically flipped positions. Now I'm getting concerned with the relative value of Tech, Energy, Healthcare, Industrials and Materials. Even Utilities have moved significantly off of their base support levels. But Financials and Consumer Discretionary seem to be of relative value at this current moment.

When running these scans I want to look for price trading mostly sideways after nearing the 20 MMA (price within 10% of MA). I prefer to see that moving average rising also. When these criteria are in place it doesn't translate directly into a buy signal, but it does mean that the stock or sector is reverting back to its trend average after correcting through time or price. Also when a group is extended from its average it doesn't mean it is an automatic sell either, it just means that price has already made its hard move off of support.

Lets take a look at a few of these to see what I mean.

Each of the green "relative value" zones fit the criteria I look for with a sector moving from in favor to out of favor. Each consolidation, with the exception of the one right before the financial crash, led to solid rotations into the group and rallies. I believe we are seeing another such zone currently. If not and this trend decides to break down, we would get a very fast signal if the support lows fail. So its either near a strong entry point or we will get a quick failure and move on to something else.

Here is where I began liking the Materials space and even commented in a weekly post about how I thought XLB was a buy (here). I like to look for these consolidation zones within an uptrend as they more often than not produce excellent value areas for the stock.

You can also see that over the past 10 months the XLB has rallied strongly and is now extended beyond its base levels. I would look to be more cautious on new positions here, current holdings can continue to be held until the trend fails, but no new money should be put to work without a base support being formed.

After seeing strong rotation and a rally, price has allowed the moving average to catch up a bit. We have seen a 6-month slowing of the trend to digest the recent big gains. While Financials have been seeing a slowing of interest recently, I believe that could be changing very soon.

Looking at Healthcare here it appears that XLV is where Discretionary and Financials were during their last rally move. Eventually the group will become too "expensive" relative to the market and it will see rotation out, hopefully creating one of those nice buy zones like back in mid 2010 through 2012. Those bases provided the launch pad for this big surge.

While this group could continue running for an unforeseeable amount of time, the current risk/reward is out of balance when compared to the XLF or XLY in my opinion.

We use this sort of analysis to help us find strong entry points with solid risk vs reward. Once an area is identified as a potential new support zone, we watch for signals from the individual stocks that move the group. Once value has been established on the long-term timeframe we can zoom in a bit and look for profitable situations within our slightly faster weekly view.

Looking inside the XLF there are a few names that are showing some good relative value.


Within the XLY there are some nice looking value zones as well.


And here are a couple of names that are not value, that I would consider more expensive relative to most.


Do remember though, just because some of these names are relative value and others are relatively expensive doesn't mean they are automatic buys or sells respectively. The purpose of this exercise is to just get a feel for what is being relatively ignored and trading near support, and what seems to be highly in favor and trading at elevated levels from long-term support bases.

This is just another way to use multi-timeframe analysis to your advantage. 

Saturday, July 19, 2014

Following the Trend is Contrarian?!

Somehow Being Bullish in a Bull Market is Contrarian

They say this late in the rally that "the easy money has already been made". Easy money?! Excuse me? What part of the last 5 years has been "easy"? Investing in today's markets is like standing in the eye of a hurricane. Everything around you is swirling, you have no idea which way to orient yourself because of all of the confusion, top calling and endless noise. While the bull market has been running for just over 5 years now and I cannot remember ever hearing that the market is safe to enter and that tons of upside is surely to come. No, for the last 5 years all I have heard is how weak the economy is and how stocks have risen too high too fast and how NOW is the time for the other shoe to drop. Yet here we are 5 years removed from the financial crisis and the market is 200% higher...no thanks to the analysts out there. I remember the way I felt in 2010 when I started investing my own money, I saw someone on CNBC talking about how the easy money had already been made and how stocks were likely topped out for this run. I was terrified! I thought, "what the hell am I thinking putting my hard earned money at risk at these 'lofty valuations'?" 

Fast forward 4 years and here we are 1,000 S&P points higher. So what does this mean for us? It simply tells me how difficult it is and is truly contrarian thinking to stay a bull in a bull market. Which seems almost crazy if you have the perspective of a trend trader. When the trend is higher, you look for buying opportunities...simple. You must not fall for the fear of a market crash, you can't listen to someone on tv talking about stretched valuations. You need to have your own compass for navigating the hurricane around you. 

If you know where you are headed, all the noise fades into the background. If you believe in what you are doing, no analyst on the news will shake your position. You know that if they are talking poorly about it then it likely has a lot further to go. If you are in a bull market (we are), all the noise of corrections and tops is not contrarian thinking, its poor recognition of the current environment. Its human nature to fight the simple path; somehow we think that if its going up it will surely have to come down. So instead of continuing to go up with it, you start looking for ways to go against it. You think you are being bold and contrarian, but what truly takes contrarian thinking is having the confidence and common sense to just stick with the damn thing. 


Rotation is Coming to Discretionary (XLY)

The sector that has my interest the most right now is the Consumer Discretionary group. The top 10 XLY stocks are CMSCA, DIS, AMZN, HD, MCD, F, FOXA, TWX, SBUX, and PCLN. Just glancing at these charts shows some very solid consolidations over multiple months and many are now resuming the prior uptrend with breakouts. 

This has been a sector left for dead by most investors and I hear things like money managers have recently gone overweight in Energy and Industrial stocks and are getting underweight Discretionary. Yet everywhere I look atop that top 10 list I am seeing very nice base setups just below all-time highs in most cases. That is not bearish activity to me, it looks like this sector is just warming up to take another run at the second half of the year. Take a look at the last year for XLY on the Daily view:

It appears that XLY is getting more and more comfortable with current price levels. We have not seen price reject that upper range like it did on previous visits. When price can continually probe the upper boundary of a long consolidation it should get your attention; a support base is building, its like a launch-pad for new highs. 

The other interesting item to note is the surge in trading volume in the past two weeks. What do we say about rotation? Money flows in and the stock moves higher. It sure looks to me like there are some big buyers here that think this market is about to resume a leadership role. The other thing you could say is that the last time a major spike in trading volume occurred, the big selling in early February, that marked the bottom for prices before a stellar rally. Now you could suggest that the capitulation selling in February could be similar here but reversed. The contention would be that we are seeing capitulation buying into the highs and are likely headed for a dip. That is certainly a possible, however the way most of the key sector stocks are behaving it looks to me like this is just getting started and this will likely lead to a push to new highs.  

Take a look at an XLY prospect and a current holding for our Portfolio, TWX. This week it made quite a move to the upside based on a bid from 21st Century Fox for $85/share. The offer was rejected by Time Warner, but the assumption is if Fox is willing to pay $85/share to buy it, the market should as well.  

This is the weekly view going back to 2007. Just look how this week's trading action played out! Fortunately we got a strong buy signal last week and were fully positioned for this move. Of course I didn't expect it, but we will take it all the same. 

I reduced my open risk on the position once the initial 18% move took place to bring the holding back to a .5R sizing. Since we cannot move our stops with a surge like this due to its speed and volatility, we have to calculate our open risk based on our current stop at 67.50. With the close of the week $20 higher than the open, it tripled our open risk in one day. That is a place where rebalancing is a prudent thing to do. Yes it could go higher from here and likely will, but I have no idea of where I am wrong now besides the previous support. Until TWX can build a new support base and bring the risk back in our favor, we will wait with reduced positions and just ride the waves, awaiting the next signal. Fantastic start to this trade huh?!

Rates Continue to Push Lower

To continue confounding the masses, interest rates have been in the one of the cleanest downtrends ever for the over 20 years. There is that contrarian thinking again, just by sticking with the prevailing trend you manage to stay ahead of the herd who are insisting on higher rates. Bonds continue to hold up well and keep wanting to push prices up and rates lower. This week TLT has been able to take out its prior swing high on the weekly chart and seems poised for even higher prices to come (i.e. lower rates). 

 While I am still not completely sold on the recovery relative to the SP500, price has shown that the 110.50 level is key support and that the 114 level was not high enough. Based on this continuation higher I have brought the Portfolio's TLT position into proportion with our new account size. I have left the previous holdings from before the new inflow alone, but will be using signal opportunities to bring them into balance with our new risk tolerance levels. So while TLT should be brought up to speed in the new Portfolio, its also still too unproven to need to increase risk at current levels. 

Remember we had a fairly large TLT holding prior to the reduction we took 3 weeks ago, so bringing it back into balance with new account risk parameters is still a nice boost for Bonds in our Portfolio. 

Entering Honeywell (HON)

Honeywell has been on my radar for some time due to its fantastic uptrend. After doubling in price from 2011 into early 2014, the stock has traded nicely sideways for 6 months and is looking to resume that uptrend on this week's breakout. They announced better than expected earnings Friday morning and was the catalyst to propel this stock to new all-time highs. 

I love this setup because it is just so clean. Here is a closer look at the breakout action:
There is no mistake that a significant breakout occurred this week. Price has easily taken out all previous highs and Relative Strength is showing a clear confirmation breakout, suggesting money flowing into the stock. The stop location is also extremely favorable here as we can use the confluence of support from the rising 20 WMA and the recent 6-week support area lows at $93. This makes for a risk of a little over $3 for the potential reward of a massive uptrend resumption. I'll take a clean setup like this every time. 


Symbols of Interest Going Forward

There were many contenders this week for entries into our Portfolio but only one really showed everything I am looking for. But we should keep a close eye on a few names that could be setting up for us soon:

Verizon (VZ) and Enbridge (ENB) are two fantastic looking setups and are VERY close to triggering strong signals. Goldman Sachs (GS) and Citi (C) look interesting if they can continue to push from here. Also Amazon (AMZN) and Google (GOOG) seem setup to move higher. 

--Sceptics say its time to duck and cover, all I know is my system keeps signalling fantastic risk/reward entries. As long as that is the case I will continue to take them as they come. While the fear is that the market is elevated, it is still above all levels of support and trading well above a rising 20 WMA and trend channel support. That is the criteria I have in place to signal it is time to be looking for bullish trades. When the market is bullish, I am bullish...If that is contrarian thinking then I think the definition of that term has been lost in translation by the Wall Street fear mongers.  


Saturday, July 12, 2014

Top Down or Bottom Up?

Top Down or Bottom Up?

This is a philosophical question every investor has to ask themselves: Do you take a Top Down approach to your market analysis or a Bottom Up? Depending on the answer, you may have very different views of the market. Currently a Top Down view would be considering that while the markets are in uptrends, they are extended and due for a correction. Your view would be cautiously optimistic. If you use a Bottom Up method, you are likely finding many interesting individual stocks that fit your risk parameters. Lets take a look at what I mean with examples of both methods.

Top Down 

The broad markets have rallied strongly for several years and especially over the short term we may be seeing the early stages of a decent pullback.

The longer a trend is in place the more concern you begin to hear from overeager participants. A hint to studying trend is to attempt to identify where you currently are in the total move. One way to do that is to watch for the slope of the uptrend to change. As the slope increases, the sustainability of the trend begins to degrade and caution is warranted. Here you can see that while the trend is certainly higher over the last 5 years, the slope of the trend has continued to steepen over time. The steeper it gets, the more likely a reversion to the mean becomes. Ultimately there isn't a good way of timing when a move like this will end, but as it continues to increase in slope, the risk of capital loss increases as well.

Taking a closer look at this view, price is testing the upper channel resistance area on the Daily chart.
Each time that prices have rallied into the upper boundary here we have seen multi-week consolidation activity, both through time and price. This current setup suggests the market is extended and needs a breather. Roughly 4 out of 5 stocks trade in sympathy with the general market, therefore if a correction in the market comes, it will likely affect most of your open positions.

Again, from a Top Down standpoint the trends are still pointing higher longer-term, but shorter-term things look less than optimal. The leading sectors for the year so far are Utilities, Healthcare and Energy, while Discretionary, Industrials and Financials are the weakest. Typically in strong markets these performers are usually flipped. If you are a Top Down investor it would likely be a good time to be reducing exposure at these levels.

Bottom Up 

Or should I say "Bottom's Up!", because some people think you would have to be dumb, drunk or both to be buying stocks at current levels. If 4 out of 5 stocks will trade lower when the market trades lower, why take extra risks here? Why not just hunker down and wait for the next correction? My answer to that is, if you have been waiting for a correction to put money to work, you have been waiting for over two years now and have missed one of the best investment opportunities of your lifetime (if you are an old guy/gal). You would have been worrying about the market being extended for a few years, yet it continues to grind its way higher.

If you had a Bottom Up approach you no doubt have found ample low risk setups over the past few years and have likely made a good deal of money doing it. While the noise in the media and economy has been deafening (it always is though), you would have been mindlessly adding to strong trending positions and taking new entry signals as your system generates them. You would have been seeking out strong performing companies with continually improving stock prices and charts.

While I showed the scary look of the broad market in the Top Down section, even this week with the SP500 down nearly 1%, we have two new signals for our blog portfolio to take and the setups are very solid in terms of risk/reward. Here is what our Bottom Up approach came up with this week:

Entering Time Warner (TWX)
After rallying strongly for the better part of 2 years, TWX has spent the last 8 months moving sideways, consolidating those gains. Recently price has been bumping against this upper resistance boundary near $71, this week we decisively broke through. The risk is very nicely defined here as the prior swing low at $67.50 can act as our stop. A failure of that low would suggest the breakout has failed and more consolidation is needed. For longer-term investors, you could use the lows at $62.50 as a wider stop. Either way this sets up nicely. Now take a look at the long term picture here for some added risk/reward perspective.

While the rally over the past 2 years has been "too far too fast" for many, a little added perspective here shows that prices are still well below the mania levels of 1999. The near term rally paused as soon as it made a higher recovery high back in mid 2013 and has since traded sideways using the prior high level as support. Now we are seeing lift off above all those highs and it appears the rally will continue. It may never get back to those lofty valuations of the dot com bubble, but even it it gets half way there we could easily double our money. When I can risk $6 for a potential reward of $70+, I get a little bit excited.

Again a move below $65 and especially $62 would negate this thesis and we would want to await further direction before proceeding.

Entering International Paper (IP)
I have been watching IP for what feels like years now. This thing has traded perfectly sideways for over 18 months. The most maddening thing is that it has done this while the broad market has been repeatedly making new highs. As you can see from the Relative trend, IP has been underperforming for nearly all of 2013 and thus far in 2014. However the last two weeks have shown that maybe the rotation is finding its way to this once loved stock. We saw a breakout of price last week but the Relative Strength hadn't confirmed the breakout until this week's action. I would now expect the uptrend to resume following this move to new highs as well as the recent shift in investor funds into the stock. Initial stops can be placed below the rising 20 WMA which would also coincide with a failed breakout signal. Below the breakout and especially below $46.50 I would want to be very cautious of this area, but above this breakout level, the sky's the limit.


It's not that one method of analysis is right and the other is wrong. These methods simply appeal to different individual mindsets and they both have their place in any investment style. I will say however that on the whole, Bottom Up investors have the much stronger track record than someone who simply focuses on the macro view of the market and economy. Legendary investors like Warren Buffett and Peter Lynch utilize a Bottom Up approach where they believe that buying the strong companies is more important than guessing what the overall economy and market will do. This is where Relative Strength investing really separates itself from the other strategies in my opinion. The very idea of relative strength is that the individual stock will perform better than the overall market. So if you have a stock that is beating the market (we have lots!), then why would you sell that stock when the overall market got weakened? Isn't the reason you are in the stock is because its performing better than the market? If it continues to do so, we need to give it the benefit of the doubt. Its strong for a reason and until its not, we want to stick with it.

When things finally turn bad out there we will be stopped out of our holdings, it will happen at some point. But instead of worrying about when that will be, just wait for your individual stocks tell you so.


It's Tough to Sell

Everyone has a way of buying into a stock; they have a tip, or some inside information on the company, or the stock just made a new high, etc. It's really easy to buy a stock. You just pick the one you want and usually you can find a reason to justify the purchase. The hard part is, when do we sell it? Because thats really the defining point of the trade; the sell point determines how much you made or lost on the initial purchase. While there is no right or wrong way to sell a stock exactly, there are simply ways of reducing risk when certain criteria are achieved. Also just because the criteria is present doesn't mean you will be absolutely correct on your timing. Take our current TLT position for example. Last week we received a warning signal from our Relative Strength trend indicator that suggested that the risk of a sell-off in bonds was now a higher likelihood than previously thought. Now looking back on this week's trading it would appear that the signal for caution was false, mostly.

Prices for Bonds rallied strongly this week, as well as the Relative trend vs. stocks. But I don't think this signal has been proven completely false yet. The price action still shows a lower swing high compared to the  recent peak a few weeks ago. The Relative Strength also shows a rally back to retest the underside of the broken support. What it will take to prove our exit signal false would be to see that RS trend continue back through the trend line to regain the uptrend AND for price to breakout and close above the prior swing highs around $114.50. A move above that and I would be inclined to dramatically increase my TLT exposure again. But short of that scenario occurring, right now its a wait and watch situation. I will continue to hold a half position until price and trend verify that the rally is over. A trade through $110 is still that key level.

The main takeaway is that being able to sell at the exact peak is very unlikely and should not be attempted without valid exit signals. You will not always be right. In fact sometimes you will end up selling at the exact lows and then will have to watch the stock move right back in the prior direction. Look at CMI as a perfect example of this.
There was a clear sell signal in early 2014 when the stock sliced through the 20 WMA and the prior support lows. There also was a clear violation of the RS trend support. We stuck to our plan and reduced risk when the signals suggested it, but within 3 weeks we had received a new buy signal; we added right back when the signals changed higher for the better. The ongoing result should be obvious by simply looking at the chart, price has continued higher steadily.

Some signals will be false, that's just part of the deal. Our job does not require us to guess which signals will work out and which won't. But we are required to take each signal without question because the system picks winners over the long-term. Our success is dependant on those few signals that turn into massive winners, those big wins pay for the many small fake-outs the market sends our way.

Once you find a way to determine when risk becomes elevated you need to act consistently and decisively. If for some reason your signal was wrong, simply adjust right back with the changing conditions. But when your signal is right, it will be really right. As famous investor George Soros once said, "its not about being right or wrong. It's about how much you make when you are right and how little you lose when you are wrong."

This is what sets apart the winners from the losers. Winners make a lot when their signals are right and only lose a minimal amount when they are wrong. Losers do the exact opposite, they lose big and win small.

I'm not sure about you, but I'm here to win.


Sunday, July 6, 2014

Stepping Up Our Game

I believe a key factor to success is to push yourself and challenge your ability to learn something new. For the past 5 years I have taught myself the markets, how to study price action, risk management, emotional discipline. During this time I have grown significantly as an investor and I strongly believe that my hard work has been paying off. There is always more to learn though and to challenge myself further. That being the case, a new challenge for me and you has been thrown down.

The Blog Portfolio will be receiving a new inflow of funds and therefore it is time to step up our game. For the past 18-months I have shared my adventures in the stock market. While I use this space to journal much of my investment thoughts, I have also hoped to help teach others who may be interested in managing their own money. We have followed a 10 stock watchlist and have allocated our funds toward that specific universe of stocks. However with this recent improvement of account equity we are going to need to expand our universe of available stocks to choose from, as a 10 stock maximum concentration puts too high of an exposure to any one particular stock. 10 was a small amount of individual names to learn and follow, but over the past 18-months I am sure you have learned to expand your watchlists as the new opportunities are much more plentiful. We will now be shifting to a 90 stock universe, the SP500 Sector Top Ten stocks. Each of the 9 S&P major sector groups are represented by the XLF (Financials), XLY (Discretionary), XLK (Technology), XLI (Industrials), XLB (Materials), XLE (Energy), XLP (Staples), XLU (Utilities). Each of these individual Sectors have a Top 10 Holdings made of the best 10 large-cap stocks in each group. Some of the names may change each year but the core typically stays the same. Names like Union Pacific Railroad (UNP), Wells Fargo Bank (WFC), Procter and Gamble (PG), and Gilead Sciences (GILD), are some of the key stocks we will be looking at going forward.

For your reference and Watchlist, here are the 90 stocks we will be tracking as we continue:

XLF                                                                           XLY
Wells Fargo (WFC)                                                    Comcast (CMSCA)
Bank of America (BAC)                                              20th Century Fox (FOXA)
JP Morgan Chase (JPM)                                             Time Warner (TWX)
Goldman Saks (GS)                                                     Ford (F)
Citi Bank (C)                                                               Home Depot (HD)
Morgan Stanley (MS)                                                  Walt Disney (DIS)
US Bank (USB)                                                          McDonalds (MCD)
Berkshire Hathaway (BRKB)                                      Nike (NKE)
American Express (AMX)                                           Starbucks (SBUX)
Met Life (MET)                                                          Amazon (AMZN)


XLK                                                                          XLI
Intel (INTC)                                                               Caterpillar (CAT)
Apple (AAPL)                                                            General Electric (GE)
IBM (IBM)                                                                 Union Pacific Railroad (UNP)
AT&T (T)                                                                   Cummins Engines (CMI)*
Oracle (ORCL)                                                           Boeing (BA)
3D Systems (DDD)*                                                   United Technologies (UTX)
Verizon (VZ)                                                               3M (MMM)
Qualcomm (QCOM)                                                   Emerson Electric (EMR)
Microsoft (MSFT)                                                       Honeywell (HON)
Google (GOOG)                                                         UPS (UPS)

 XLB                                                                           XLE
Freeport McMoran (FCX)                                          Chevron (CVX)
LyondellBasell Industries (LYB)                                   Conocophillips (COP)
Dow Chemical (DOW)                                                Apache (APA)
International Paper (IP)                                                Exxon Mobile (XOM)
Nucor (NUE)*                                                            Occidental Petroleum (OXY)
Monsanto (MON)                                                       Anadarko (APC)
Air Products & Chemicals (APD)                                Halliburton (HAL)
DuPont (DD)                                                               Schlumberger (SLB)  
PPG (PPG)                                                                 EOG Resources (EOG)
EcoLabs (ECL)                                                           Enbridge (ENB)*

XLP                                                                            XLV
CVS Caremark (CVS)                                                United Healthcare (UNH)
WalMart (WMT)                                                         Pfizer (PFE)
Phillip Morris (PM)                                                      Express Scripts (ESRX)
Altria (MO)                                                                 Medtronic (MDT)
Pepsi Co (PEP)                                                           Abbott Labs (ABT)*
Costco (COST)                                                          Merck (MRK)
Procter and Gamble (PG)                                            Johnson and Johnson (JNJ)
Hain Celestial Group (HAIN)*                                      Amgen (AMGN)
Coca Cola (KO)                                                         Bristol-Meyers Squibb (BMY)
Colgate-Palmolive (CL)                                               Gilead Sciences (GILD)

XLU
American Electric Power (AEP)
PG & E Corp (PCG)
Exelon (EXC)
PPL Corp (PPL)
Con Edison (ED)
Duke Energy (DUK)
Southern Company (SO)
Sempra Energy (SRE)
Next Era Energy (NEE)
Dominion (D)

* stock not included in the actual Sector ETF. They are individual selections made at my discretion.

So thats a lot more to follow than 10, but its time to take this to the next level. This is the watchlist I regularly use and if you are going to be a relative performance investor, you will need a more broad mix of the actual assets moving the markets. The way I manage my other accounts is I take signals generated by my trade plan (as we do with our Top 10) from this more broad mix of stocks. I focus on these stocks as they are the best and biggest of the best and biggest. The SP500 is made up of 500 total stocks, so our list still omits most of the stocks in that index and only focuses on the top 20% of companies.

The open management of trades will be similar to what you are already used to, with a few slight changes. For example, instead of splitting buy signals up into 3 increments, I simply use the 20 WMA breakout signal coinciding with the Relative Strength trend shift to enter a position. The position size and trade management is determined using the "R" metric I discussed here.

If this feels overwhelming to you then you can choose to pick a few of these to add to your current list of 10 and ease yourself in. But I base all of my weekly research off of these 90 stocks and will be sharing information relevant to them all. Again, to grow as an investor you will need to push your comfort zone a bit and get a more full view of the market place. That is what I will be working to help you with. You have made it through the beginner stage and now its time to move to a more intermediate level. For me this will be a big opportunity to manage money the way I believe is necessary to have strong success in the markets. We will be buying winning stocks in uptrends just as before and will be focusing on risk management as our #1 priority.

Warren Buffett has two rules for managing other people's money:
Rule #1. Don't lose your investor's money
Rule #2. See rule #1


With that being said, lets look at this week's Portfolio additions and subtractions.

-Reducing TLT position by half on RS trend failure
Treasury Bonds have been in a Relative Uptrend vs. the SP500 since the beginning of 2014 but now have created a lower low in the trend and broken the uptrend. Price was just able to hold above the 20 WMA and is sitting on our stop level. We will take half of our TLT exposure off and will await further direction.

Another continued move lower from here will likely see our remaining position sold, while a breakout above the $114 swing high would suggest more upside to come. We will see where this goes next. The last time TLT broke its uptrend and issued a sell signal, stocks rallied for from May through December of 2013. So while its not looking the best for the bonds space, stocks could be ready to run again.

-Reducing AEP for RS trend failure
We also received a failed RS trend in our Utility leader AEP this week. The price action is still intact here above the all-time high resistance level, uptrend support and 20 WMA. But Strength is beginning to weaken and it makes sense that Utilities would struggle at the same time as bonds as they are interest rate sensitive. With the strong jobs data reported Thursday morning, rates bounced as they would if the economy were turning a corner. I think a reduction of 1/3 of positions makes sense here. We want to be in this stock while its in breakout mode, but if its going to lag the market in any way, as the RS may suggest, it is prudent that we take some risk averse positioning.


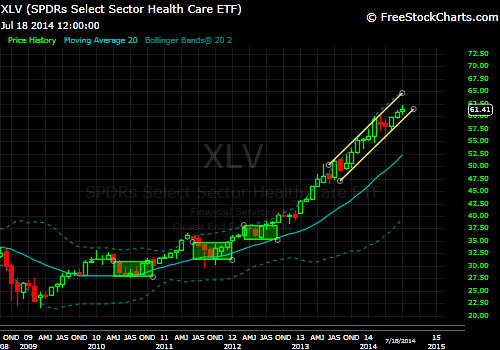
+Entering Gilead Sciences (GILD)
As is consistent with this week's theme of selling defensive and buying offensive groups, GILD makes its way into our Portfolio. Gilead is a leading biotech company who has displayed strong growth and increasing investor support. After recently consolidating its substantial uptrend, prices seem to be resuming in the prior direction with this week's strong breakout. The price action has the look of a rounded Cup/Handle formation and this continuation pattern targets prices near $110. That would be our first target on entry and we will place our initial stop just below the recent swing low from last month. A break of that low and a failure of the rising 20 WMA would be enough to signal a failed breakout attempt. We will call it $77 for now. Above $77 though this looks like a continued winner.

+Entering Freeport McMoran (FCX) 
FCX has been in a steady downtrending market for several years now, that was until this week's move above the prior swing high that has invalidated the downtrend. This is a great setup as the upside could be fantastic compared to the initial risk of entry. The stock has declined over 50% from its highs back in 2011 and therefore we could see a potential 100% move to the upside if it wishes to revisit those prior levels. The support base is strong and initial stops will be placed below the breakout swing low and rising 20 WMA at $33.50.

That is a pretty wide stop so don't be surprised if the position size is smaller than usual at first. The beauty of a setup like this though is that as our stops trail the price higher we will have plenty of room to increase our position size should the trend continue to move in our favor. If it fails quickly we will take a small loss and move on. If this turns into a major bottom, the upside could be huge.


--Changes to be implemented from this point forward:

1. Stock universe to expand to 90 stocks, from 10 previously
2. Positions will be entered based on 20 WMA/RS breakout signal
3. Position size and trade management will be based on "R" metric
4. To reduce whipsaw situations from largely impacting our portfolio we will limit new portfolio additions to a maximum of two new positions per week.
5. Due to the potentially increased number of open positions at one time, the initial R will be set at .5R. Meaning we will be willing to initially risk .5% of our total equity value on each new position.

Tuesday, July 1, 2014

Do You Understand Your "R"?

"R"isk is the single most important factor YOU CAN CONTROL in the marketplace. Once you enter a position, you are at the mercy of the market to prove that idea right or wrong. We simply have no control over what the market does with our money once we put it on the line, but what we do have control of is (roughly) how much we are willing to lose if this idea happens to be wrong.

In investment lingo we call this notion "R". R is risk, R determines how much of a asset you can own and it determines when that situation is moving outside of your comfort zone. Knowing what R means is one thing, putting it into practice is another.

Quite simply R is the amount of money (in dollars) you are willing to risk on a bet. The way we derive this number depends entirely on you and your individual risk tolerance. For the sake of discussion we will use the risk parameters I set for my own trading systems, which is 1R or 1% of my total portfolio value. I am willing to risk 1% of my trading capital on any one position. That ensures that even if I suffer a string of losing trades, I will still have substantial equity to continue my positive expectancy trade plan. Lets assume your investing account is worth $10,000. 1% of 10,000 is 100. So if you put into practice a 1R risk level, you are willing to risk $100 on any one trade.

Next lets use this risk amount to determine how much of a stock we can buy in one sitting. If we can lose $100 on the trade and be within our predetermined risk tolerance, you need to figure out how many shares of the stock you can own while only risking $100. Lets say you want to buy Verizon (VZ), VZ currently trades near $50.

The first thing we want to do is look on the chart where the major support is and where your trade will be proven too high risk. At a glance, the $46 level looks like the major support. So we have our entry price $50 and we have our key support (stop) at $46. The way we calculate risk is to take the difference of our entry price 50 and the stop level 46, that equals 4. We risk $4 per share if we buy VZ with this method.

Now we know that we can stand to lose $100 per trade and with our entry here we can lose $4 per share. So we divide 100/4 and get 25. We can buy 25 shares @ $50 per share with a stop at $46 and be within our 1R risk preference.

Trade Re-balance
Once we know how to determine our R, we can assess risk at any point during our trade. An idea that was presented to me some time ago was the idea of maintaining proper balance of your portfolio using your R amount. This is called Open Equity Risk. Lets say for the sake of argument that after our VZ entry that the stock surprisingly jumps to $55 very quickly. Trailing stops and moving averages tend to lag the current price action and have a hard time adjusting to such a quick, violent move. That leaves us in a slightly uncomfortable position in that you have a trade with a dramatically higher price and your stop is still in its initial place. What was once a 1R risk from 50 to 46 is now stretched over 2R from 55 to 46.

We can determine if we want to continue the trade untouched and let it just ride, or we can see how our risk has changed with this recently changed environment. We are going to figure our risk exactly like we did originally but with the new range of price. The difference of 55 (current price) and 46 (stop) is 9. If we have 25 shares with $9 per share risk we now have a total open risk of 9x25= $225. We had previously determined that we could risk $100 as our 1R figure on any trade, and while technically we still risk that original $100 amount, we now have a new situation to deal with. If the market where to move against us from here and stop our trade out, we would have lost $225.

This idea is what is known as Open Market Risk and is a topic of some debate. Whether you choose to continue to hold the position as is or you reduce your holding size to account for the risk is a personal preference. The way you would bring your portfolio back into balance of 1R would be to simply determine how many shares you could own at $55 with a stop at $46 where you are only risking $100. $9 is our difference between current prices and the stop and 100/9 is 11. Therefore you could own 11 shares to be within your 1R, so you would sell 14 shares at the current price. This way, you can book the gain, maintain a position in the uptrend and keep your portfolio and trade within your risk tolerance.

Adding to Positions
I use R all the time in my trading, one place in particular is when I have a new Add signal for a current holding. Once a stock triggers a new Buy signal based on my system, I determine the stop placement after the breakout and figure my R based on the breakout price and the new stop price.

Lets look at a trade in motion currently: I have eyes to add to ECL if the breakout early this week can carry into the weekly close Thursday (Friday is the 4th of July).

 With this potential breakout this week, it looks like I will be able to trail my stops up to the swing low just above $106. We will assume for this example that price closes around this $111.60 area and we will use that as an initial level to determine the current open risk we would have in the position.

With current prices at 111.60 and the expected stop to be about 106 that leaves us with 5.60 as the amount per share that is currently at risk; I currently hold 37 shares of ECL.

5.60 risk per share multiplied by 37 shares equals $207 of total open risk. Now the 1R on this particular account is $400 so it would appear that I am under-invested based on a 1R risk guideline. Therefore I can add to the position on a confirmed signal, up to a $400 total risk or roughly double my current holding size.

As a side note: I rarely would double the size of a current holding for a continuation signal. Most likely I would add half again as much and just be content to have a slightly less risky position. Just because you set a 1R limit on your risk doesn't mean you have to push that limit on every position. Sometimes it is best to simply hold a .5R, but in a situation where the stock is acting right and generating a new signal, that is where I look to take advantage of a lower risk situation and increase my exposure.


--With that little lesson, you should have a good feel for how to keep your risk in some way organized. That is THE key to this whole game. If you can keep your risk in control, your profits will take care of themselves (provided you don't attempt to sabotage yourself by taking premature gains too soon). Understanding how much you can risk will keep you playing and learning without seriously jeopardizing your long-term plans. Always know your stops, keep a balanced portfolio where excess risk isn't lopsided, and continue to calculate your R and you will be on your way to success.