**Posted Friday. I will be out of town this weekend, but needed to get this post out as I feel it is fairly urgent due to today's (Thursday) action. All charts are weekly charts, with this week's bar only showing trading through Thursday.
Today we saw a down turn that invalidates our short term breakout trade. While the markets have churned in a consolidation pattern for a few weeks, today's trading action violated the lower end of the consolidation range. This not only broke short term support levels, but it also created a false breakout on the SP500. The implications of the breakdown however are still minor as price is well above key long term support levels. I will be interested to see how Friday's action confirms or rejects today's support failure. The stories justifying today's trading woes throughout the financial media are due to the Federal Reserve's "likely" tapering its QE program at the next meeting in mid September. The market and many of its participants are behaving as though the September reduction is a done deal, while I feel it is still quite premature. The Fed Chairman, Ben Bernanke, has stated ad nauseum that the QE program will continue until the national unemployment rate is reduced to 6.5%; currently it sits at 7.4%. I assume we are all reasonable people here and we understand that 7.4 and 6.5 are different numbers and are not equal to one another. Okay, so we agree 7.4 does not equal 6.5? Good!
Apparently all of Wall Street and the financial media believe that these two numbers are the same thing and Fed tapering will ensue at the next meeting within the next 30 days. I'm not an economist, but I'm pretty sure it will take more than one employment report ( one month) to lower the unemployment rate a full percentage point. All this talk and concern about this imminent tapering is complete B.S. and is only intended on scaring the shit out of every retail investor that happens to listen to the news. Luckily for us all, our fearless leader (Yours Truly), can see through such a blatantly slanderous ploy, and am here to help you navigate what will no doubt be a volatile next 30 days of trading. For another, excellent explanation as to why tapering will not occur in September, I recommended you read
the latest post from trader Joe Fahmy. Joe hits the nail on the head as far as I am concerned and I couldn't have stated it better myself, so do check it out!
Now, I am roughly 98% sure that the Fed will maintain its current policy at the September meeting. That does not mean however that I feel the market is safe for the near term. Thursday's breakdown will likely create some stressed out Bull's who bought the breakout and don't want to sell. Just know that the market will test your reserve at nearly every turn and those participants will be tested, rest assured. I believe that both sides will be tested soon which should create some interesting movement in the market. The next 4 weeks will likely bring increased volatility and plenty of talk that the financial world is coming to an end. My plan will be to hold onto longer term positions (Blog Portfolio included) while the individual names still maintain a relative advantage to the market. We want to keep an eye on the broad indexes, but this next 30 days will really be about the individual stocks that seem to hold up the best. These we will want to buy heading into the September Fed meeting as the market should overcompensate and rally strongly on news that the QE program will remain intact for now. Plans can always change, but I believe the hysteria over the September Fed taper and the early fall Debt Ceiling debate, will create a very nice buying opportunity into the peak holiday earnings season. I would recommend using this opportunity to raise some short term cash from the weaker holdings in your accounts, those under-performing and breaking below key support levels. This cash will be your dry powder for a move out of the Fed meeting and portfolio protection over the near term. I think it would be wise to raise around 25% cash (obviously you will have more cash if your holdings weaken significantly). This you can take out of some nice gains you have gotten recently or from stocks that just have you confused or stressed in any way.
This time of increased volatility is a time to do some portfolio cleanup; get rid of the riff raff that has you stumped or at a loss, and only hold onto your strongest, most confident positions. This will allow you to create some dry powder and also be sure to be investing in only the market leading names. A portfolio clean out is something that should be done a couple times a year; at times of market transition it is always prudent to make sure you are only holding what you have the most conviction in and discarding anything else that is causing your account harm.
Today we are going to take a look at our Portfolio from top to bottom to make sure we are only holding the leaders and/or strongly positioned stocks...Lets try to clean out any holdings that are lagging.
Current Holdings
XLF, XLY, XLK, XLI, XLE, XLV, XLP
HAIN, F, HD, WFC, DDD, PBW, PPG, CMI, AAPL
Cash
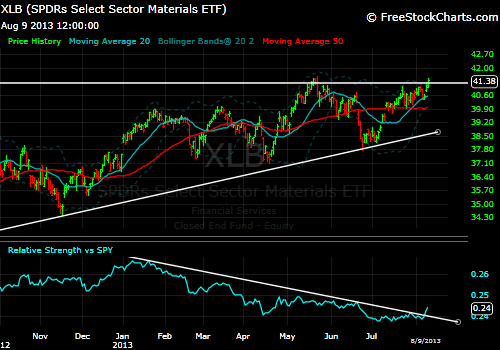
XLB, XLU
ENB
XLF
The XLF is still holding up and is above all major support levels. As long as the uptrends persist we will stay long. Friday's action should have no problem holding the rising 20 WMA. That moving average along with the RS support trend will act as our stop.
XLY
Pretty much the same as the XLF. Discretionary looks fine here. We will stick with the outperformance and uptrend.
XLK
Tech is close to doing something...what it does next though, I'm not sure. With AAPL showing such relative strength recently I would not be surprised to see this continue to breakout. But due to the rest of the sector's weakness, it would also not surprise me to see this rollover here. Key trend support and RS resistance rejection would likely be enough for an exit.
XLI
XLI looks to be breaking out on a relative basis and is still making higher highs. Industrials look good here.
XLE
Energy is still slogging along the upper breakout area. Its holding its breakout and above the rising 20 WMA. We will stick with it until it rolls over below the breakout level and uptrend support near $78. Or if we see RS trend really turn down that would also be an exit signal.
XLP
XLP has broken down and is now on the chopping block for Friday's trading day. Price is failing the 20 WMA, along with the RS weakness we have seen recently, these two signals will see our exit at tomorrow's close provided they do not recover.
XLV
Healthcare is still strong and in an uptrend. No reason to doubt it here. ~$47 is key support.
HAIN
HAIN is showing a very nice Rounded Bottom pattern or Cup/Handle. This pattern is in play and price has held the breakout level for over a month. With earnings due out this coming week, we will see if the story justifies the price. A failure of this pattern and our position would be a break of the $62.50 price support and handle low.
F
Ford is fine here. Looking like a very strong rally that could use a breather before heading higher. Stick with this above trend support near $15
HD
HD is another one that is testing our mettle. Relative Strength is rolling over here and confirming a new relative low by failing the support (Red line). Price is now testing long term uptrend support but has broken the 20 WMA with today's sell off. If we see no bounce back attempt tomorrow, we will likely exit the position at tomorrow's close. Because of the strength of the trend I may be inclined to give this a little look before selling. Tomorrow will determine a lot.
WFC
Wells is still in a strong uptrend and has held up well despite the recent consolidation. Relative Strength is still above a breakout area and I would expect a pullback to that support coincide with price testing the rising 20 WMA.
DDD
DDD is stuck in sideways indecision. The shaded support area will be of major importance; depending on which way price moves out of the support range will determine our position going forward. Now that price has consolidated, the rising 20 WMA has had a chance to catch up to price. The 20 WMA and range support will be our invalidation point.
PBW
Clean Energy has seen 4 weeks of corrective action. Based on the direction of the 20 WMA (rising quickly), the trend is strong. I would expect that to serve as support after the recent 10% decline. We have seen strong buy support since the breakout in early May, and I expect that to continue shortly. Because of the strong technical position this is in, I am inclined to let this run as long as its above the support at $4.90.
PPG
PPG is still managing to make higher highs and is solidly above all trend support. Stick with the uptrend.
CMI
One of our newest holdings, CMI has seen strong price action and relative performance since our entry and this looks to be in good shape. Something to note is the larger range that we are now testing. I like how we are seeing the relative breakout along with the smaller range breakout occurring right at all-time highs. That signals strength; the fact that CMI has managed to achieve all this at a time when the market is showing signs of rolling over reinforces the strength.
AAPL
Our other newest holding is AAPL. Boy, we couldn't have timed that better! Thank you Carl Icahn. In case you missed it this week, legendary activist investor Carl Icahn announced this week that he has taken a large position in the stock and is in discussion with AAPL's CEO Tim Cook to aggressively increase their share buy-back program. Carl announced via Twitter that he feels AAPL is greatly undervalued and the stock has gained nearly 10% since his comments. When an investor of this magnitude publicly announces a position like this, you can see the result that follows. Be glad we are in this and lets enjoy the ride.
All in all not much damage done to the longer term charts with today's sell off. Today is just the first shot over the bow for the Bears. They are going to have to muster much more gusto to take this market down without a fight. The bottom line for this week is don't fear every pullback in the market. Accept the fact that markets go in both directions and that its the dominant trend that should be obeyed over the day to day noise. Ignore the media, focus on the trend. So far, the trend is bullish stocks and in line with the Federal Reserve. Don't stray from this momentum until it is proven to be broken. One day does not a correction make; we will need to see much more deterioration to shake out our winning positions.