Looking at the chart, the setup is very clean. I like to see very defined levels in my trades as that makes it very clear when to enter and when to exit. The Daily view shows a textbook bull flag, with today confirming the breakout.
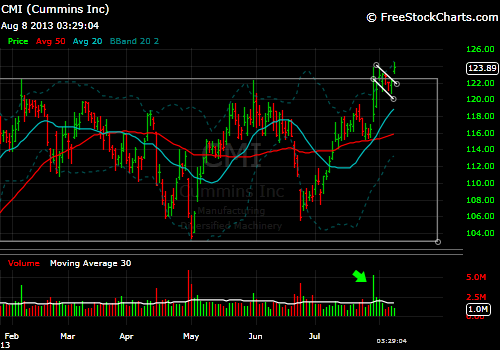
You can see the flag here formed from the earnings report rally at the end of July. That initial rally (flag pole) was on massive trading volume and the subsequent consolidation (flag) came on steady, declining volume. This is exactly what we like to see with this type of pattern. It shows very strong interest in the stock, followed by a light and orderly profit taking by short term traders. It is also positive to see the pattern form and breakout at a well defined resistance level.
The Weekly view shows us where our risk will be monitored and also confirms our key entry signals:

No comments:
Post a Comment