Sunday, February 23, 2014

Weekend Update: Assessing Our Holdings Strength

 As was reasonable, markets traded more or less sideways this week after the prior strong two weeks. The market finds itself at an interesting decision point. While price is again testing all-time highs, the internals of the market are slipping a bit and appear mixed. Utilities are the leading sector year-to-date, Gold and Bonds continue to see positive fund flows, and the number of stocks participating in each rally continues to decline with each bounce attempt. When the market makes new highs we want to see more stocks in uptrends than on the previous new high attempts, if fewer stocks are showing strength as the market continues higher it means less leading stocks are powering the broad market advance. This is called a negative divergence and we would want to see this correct itself before the market runs away too much from here.

There will no doubt be a bit of "Double Top" talk this weekend and into next week, but until we see a weekly close below 1,775 that will just be noise and we have to assume new highs are still the most likely outcome.

We had no changes to the Portfolio this week so I want to take a look at our holdings and determine which ones look the strongest at this current point. We will rank them 1-10 to see if we are positioned correctly according to strength.

1. CMI 3/3
CMI currently gets our #1 ranking for strength. Despite the strong surge the past two weeks it once again posted a positive week and most importantly CMI continues to make higher highs while the market has not. New all-time highs, relative outperformance vs the SP500, and strong price action give CMI our top billing.

2. AEP 3/3
Coming in at a close 2nd is our Utility holding AEP. This just continues to rip since breaking out from its consolidation base a month ago and is now about to challenge its all-time highs going back nearly 20 years. There should be significant resistance around 51-53, but a move through that range would be very positive.
The measured target for the inverse head/shoulder pattern is $53.50, so momentum certainly favors a run at the highs.


3. PBW 2/3
Clean Energy needs to be watched closely here. We have been tracking the large reversal base that has been under formation (blue lines), but now we have a nicely developed smaller pattern to act as the catalyst for the larger breakout. Here is a closer look at the latest formation:
This is the Daily chart for Clean Energy showing the zoomed in view. I will be watching for a weekly closing price to breakout above the January highs. If/When this breaks out we will add another 1/3 position to align ourselves for the rally.

It is a positive thing to see where one bullish setup leads to another and so on. We have seen this continuously in PBW. And once again we see its favorite pattern developing. 
Even though the new smaller pattern here will target the $8 area, we will be trading the larger setup on the same breakout and targeting the $10.40 level for our position.
And above another possible setup (yellow) that could be formed by the completion and pullback of the current formation (blue). This is how a long-term support base is built. None of this has to play out of course, but if I was drawing the road map for how this is setup going forward, this is how I would do it. All I see and have seen over the past year+ is positive price action and fund flows. I currently see no reason for this trend to slow over the next 5-10 years. I like what I see here on every timeframe! That's a fun thing to watch.


4.PPG 2/3
PPG has been able to hold right near all time highs. It has been an in-line performer vs SP500 over the past several months but a breakout to new highs confirmed by a breakout Relative to the market would set this up for another leg higher. PPG looks strong here. There will be a solid support base built off of $180 and should be an area of interest on any future weakness. Above $180 its Long and strong!

5. WFC 2/3
Wells and the rest of the Financials have been slow to tag along recently. Support is still holding and WFC is at all-time highs, so nothing too bad is going on here. I will really want to see the trend Relative to the market hold this support test coming up to believe that the Financials are not ready to correct significantly. 6 of the 10 XLF Top 10 holdings are trading weakly and below their 20 WMA's, and none of the strong 4 performed well in the last couple weeks. BAC has been flat to lower and USB, AMX, and WFC have all failed to make higher highs on this most recent bounce.

If the market is really going to become weaker, the Financials will likely lead the way on the downside. This will be a space to watch closely in the coming weeks.


6. HAIN 2/3
Hain continues to trade heavy following its most recent earnings announcement, yet is also continues to hold all intermediate term support levels. The $80 level has acted as a spring board when ever it was tested, and on a weekly closing basis prices have not ended below $84. The uptrend line both in price and Relative continues to hold and see buyers. Hain is at a place reward/risk ratio is as good as it gets. We will know really quickly if this wants to turn down and roll over. A weekly close below $84 will likely be the signal that the rally needs a break.

7. DDD 1/3
Man this thing can whip around! DDD added another 9.4% this week and is now off the correction lows by nearly 48%...48% gain in 2 weeks! This is exactly the reason I wanted to not trade an all-in all-out method and decided to involve a scaling method to my holdings. An all-in all-out method would have likely had me exit my entire position at the $66 close 3 weeks ago. But with the individual signal method we were still able to maintain half of our remaining position based on the strong Relative uptrend, and therefore continue to participate in this recent surge. While we didn't make as much as we could have, we didn't dump the entire holding and have to watch this run away either.

Currently I don't really know what to do with this stock. It has managed to jump right back above the 20 WMA, but also has the look of putting in a sort of Head/Shoulder Top formation. I really need to see some consolidation before I want to increase my exposure. Basically a 50% smack down in a 5-week period, followed by a 48% snap back bounce in two weeks doesn't exactly set the stage for sound risk management. We will stay small in our positioning and just let this run around until we have some form of solid support base to proceed further from.

8. TLT 2/3
Treasury Bonds are still working on that Double Bottom formation. There has been some mild consolidation over the last couple weeks and if price is going to make a run at the prior swing highs it will likely do so from close to current levels. I would expect the 20 WMA to hold and for another leg higher in the coming weeks. Again I feel a break above 109-110 on a weekly basis would be poor sign for risky assets.

9. UNH 0/3
UNH is just hanging out, chopping sideways. We have seen price retake the rising 20 WMA, but it has not made a new high above the prior weekly closing range. It will need to take out the prior closing highs near $75 along with a Relative breakout to signal an entry. Its close and I like the setup, but it just needs some more time.

10. F 0/3
F is in an intermediate term downtrend. The channel is well defined and the 20 WMA has a fairly aggressive down slope. If $14.40 fails to hold as support, the next area of interest comes in around $12. Weak price action abounds and we will stay away until support can hold and then reverse the current downtrend.


----
All in all I would say we are positioned correctly considering the current strength and weakness in our Portfolio. Herein lies the issue with a small, focused watch list; we simply have to be patient and wait through dry spells until some if our stocks regather themselves. If we used a wider list to draw from we could likely still find plenty of setups to occupy our funds. That is the downside of following a narrow list like we do, but there are positives as well.

 By only watching 10 stocks (1 from each sector group), it gives us a pretty good idea of how aggressive we should be positioned in any market environment; our individual stocks will tell us when to be in and when to be sidelined. Due to the weakness in a few areas we are holding roughly 50% of our funds in stocks at the moment, 10% Bonds and 40% in cash. With a market that is showing weakening internals while trading at all-time highs, I think it is interesting that by following our 10 holdings we are positioned more neutral at the moment. We are not heavy stocks, we are slightly overweight but not by much. We have a little nibble of Bond exposure as they have corrected substantially over the past year. We also hold a solid amount of cash in our account as portfolio protection near market highs and as an opportunity should conditions improve and our lagging stocks signal entries.


Saturday, February 15, 2014

Weekend Update: Follow-Through

As we discussed last week the ball was in the Bulls court. They had been able to recover the first major support zone and now we needed to see if they could continue to push the market back to the upside. When a "Hammer" pattern is formed  like we saw with last week's trading, the pattern is not confirmed until there is confirmation follow-through on the next bar on the chart. Take a look at this:

There was strong follow-through this week as the SP500 is now testing its all-time highs. We have seen this trading action before during this rally and each time this has lead to higher highs. So far this is the best result we could have hoped for in terms of the health of the uptrend. Good stuff!

It appears the market is still following last year's playbook and the Bulls are leading the way. This is why its not a good idea to get too antsy to sell during a bull market; there will be shakeout attempts along the way, that's what keeps the rally sustained. We are still seeing the market set up the Bears to be annihilated. Every time the Bears think they have an edge and press their bets the market comes through and scorches them. This is still working on the psychology of investors and will eventually lead to the slaughter of the Bulls as at some point these bounce backs will not occur. This will leave most in disbelief and the market will correct, taking them with it. Which is exactly why we will continue to acknowledge each signal we receive because we simply do not know when the next truly big move will occur. But by following our trend signals we will always be warned in advance by the market when a major shift is underway.

I want to update our trend channel for the SP500 chart. We have seen three Hammer type reaction lows over the last 8-10 months and i feel those will be the most important lows to watch. Here is what it will look like:

 This new trend support connects exactly with the three tests lower and each low was a shakeout attempt as they all breached the 20 WMA on an intra-week basis only to see buyers return in force. The very idea of strong support is identifying where real buy interest will be. So far the most impactful support has come from these lows. In my opinion this has become the support to follow moving forward.

--
Since we only had one adjustment for the Portfolio this week where we added to CMI (here), I think this would be a good week to take a look at the market internals and see which sector groups are performing well and which are showing weakness.

Financials XLF
Financials have performed average relative to the market over the past couple months, some ups some downs. They have managed to hold the prior breakout, now support at $21. Once the 20 WMA was violated prices were able to stop and bounce right back. XLF is okay right here, but we will need to see trend support continue to hold up.


Discretionary XLY
Discretionary has been a close focus of mine to begin the new year. So far it has been fairly unimpressive but still seems like the uptrend is intact and the relative uptrend is still fine. Since it has retaken the support at $64 I think it is fine at this point.


Technology XLK
Technology closed at a new high this week and has been a solid relative performer year to date. Everything to like here above $34.


Industrials XLI
Industrials have shown some vulnerability yet prices never violated key support. The RS trend is back testing support, but as long as the uptrend is intact I like this group.


Materials XLB
Materials made a new weekly closing high this week but relative to the market XLB is simply performing in line. The support at $43 has held on this test and this still points higher above that level.


Energy XLE
Energy has definitely been a laggard to begin 2014. The bounce back rally over the last two weeks hasn't even been able to retake the now rolling over 20 WMA. Price also is on the underside of the uptrend support going back over 18 months. If you are Long Energy names, it is time to watch them very closely. If the low at $82 fails I would not want anything to do with this space.


Staples XLP
Staples are a mess right here. When looking at this chart I had a hard time seeing anything truly positive or negative. Price has not been able to retake the 20 WMA but the short-term support has held on the correction. Relative to the market Staples have been very weak and price is forming what looks like a broadening pattern. Each swing in price moves further from the last move and prices become more volatile. This is an area to avoid right now.


Health Care XLV
Health Care has been a beast. Still leading the market, still making new highs, and still dramatically outperforming. This is a great area to be looking for setups if you are trading this market. The Biotech area especially has been strong.

Utilities XLU
With all the media talk about corrections and bounces this week nobody said anything about the strength Utilities are showing. XLU broke out in a big way this week both on a relative and price basis. This breakout for the sector lagged our breakout entry into AEP two weeks ago, so this only reinforces the likelihood that our AEP position is setup for much more upside to come. Utilities however don't typically outperform during strong market rallies, so seeing this happen at this point is interesting and will bear close watching in the coming weeks.

20+ Treasury Bonds TLT
The TLT was once again thwarted at the $110 resistance level. We knew this would be the crucial inflection point for risky assets over the near term. While this test and failure does not kill off the possibility of a strong rally in Bonds, it does create a situation that will need to be monitored very closely as we go ahead. The two key points will be the resistance at $110 and then the 20 WMA support with the consolidation breakout zone since the end of last November. Basically any movement between $110-104 is more or less meaningless and it will take a break of either of those price ranges to indicate where the next move is headed.


Gold GLD
Gold was able to breakout strongly this week and short term the momentum seems to be there. You can see the relative breakout vs the market recently as well as price retaking the 20 WMA. We have not seen the 20 WMA turn upward yet and price has still not made a higher high in this larger downtrend. I definitely would not want to be Short here, but I also would not be interested in going Long just yet either. This will take a little more time to play out if the lows are in place for Gold. Don't worry, if Gold can make a higher high, there will still be plenty of time to participate in the upside that could follow. In fact there does seem to be a double bottom pattern formed currently from the lows in June and December of last year. For this pattern to complete however we would need to see price break above the rally high between the two lows at about $138. At that point there would be a nearly $20 price pattern in motion and would then have made not only one, but two successive higher highs. At that point we could say the bottom was in for prices; currently I am not completely convinced the long term downtrend is over


--An interesting note on the XLU, TLT and GLD:
These 3 asset classes, Utilities, Treasury Bonds and Gold, are all acting as though more QE is on the way from the fed and interest rates are still headed lower. Here is my rational for this idea:

Utilities show strength (see positive fund flows) when investors seek yield and/or safety. Investors seek dividend paying stocks when interest rates on more safe savings accounts are low; they still need to make a steady return on their money but they are risk adverse and seek steady, safe equities.

Treasury Bonds perform inversely to interest rates, if rates go lower, bond prices go higher...simple. What is also of note is that when the Fed is providing stimulus and buying Bonds, Bond prices will be supported. Investors also seek Bonds in times of worry as they are safer than stocks during a downturn in the economy.

Gold is a fear and inflation trade. When Gold is moving higher it means investors have more fear in something bad happening and/or they believe inflation will rise in the near future. Inflation (at least the theory goes) increases when the Fed prints more money for stimulus. More dollars with the same tangible government net worth creates dollars that are worth less than they were before additional was printed.

I think it is fascinating that these three groups are showing positive signals currently. It is possible that this will not play out and stocks will roar back. But it is also something we need to see develop to determine if the strength being shown in these groups will be reflected inversely in stocks as is usually the case. Each of these groups thrive relative to the market when stocks are weak. The big moves in Gold and Utilities this week along with the broader markets suggests something is moving under the surface with either weaker stock prices to come or more easy money from the fed. Treasuries acted as you would expect on a strong stock market week, they traded lower in the normal fashion. It will be interesting to watch this develop over the coming weeks and I will keep you posted on any new developments.

Friday, February 14, 2014

Adding to CMI holding

We have two Buy signals that triggered this week in CMI. I will add 2/3 position based on a 20 WMA signal and Relative Strength breakout. We had seen this breakdown a couple weeks ago and we reduced our holding size to 1/3 as the confirmed Cup/Handle pattern was the only bullish signal that was valid. CMI appears to have given a nice shakeout move and is now retaking its prior uptrend. To be stated simply, we have confirmation of further strength present in the stock and therefore I will now be holding a full 3/3 position.

 Here we see price breaking back above the rising 20 WMA after temporarily failing 3 weeks ago and price is making new multi-week highs. This is what we look for as one of our signals of strength. Yes price has rallied hard in the past 2 weeks, and yes we might have ended up buying the highs. But typically this is not a sign of weakness, it is a sign of strength.

Most people have a misconception that you want to sell strength and buy weakness, which then logically follows that you sell your winners and buy your losers. But as legendary investor Peter Lynch says, "Selling winners and adding to losers, is like pulling the flowers and watering the weeds." I love this quote and I believe he is exactly correct. Most will not be willing to buy new highs and prefer to buy on weakness, some are very good at this, but often a breakdown leads to more weakness and a breakout leads to more strength. New highs most often lead to more new highs. 

Just personally I prefer to buy breakouts rather than pullbacks because of the simple fact that a breakout signal is black and white, pullbacks are not. On a breakout, price makes a new high...simple, obvious and shows tremendous strength. Buying a pullback, you are never sure if this is as far as the pullback will go, will this support hold, what do I do if it continues to weaken, etc. It just leaves a lot up to feelings and interpretation and often you are buying something that is weakening for a reason. If a stock is making new highs, it means there is huge demand for shares and the company is one if not the industry leader. When a stock is selling off it often means no one is willing to pay a higher price for shares, there is excess supply on the market, and/or the company is weakening fundamentally.

This is a personal preference, but for me and my simple view of the market, breakouts are crystal clear and show great strength which often leads to even higher prices.


After the big move down through the 20 WMA which also triggered a breakdown in the intermediate term RS trend support, price both nominally and relative has broken back above prior all-time highs and the 6-month downtrend in Relative Strength. We can see here where the RS trend failed recently and with the last 2 strong weeks, the price relative to the market is ready to resume its uptrend by breaking out convincingly this week.

It is often the case that a trend following trading system will be whip-sawed from time to time; Buys will signal at highs and Sells will signal at lows. But every signal needs to be obeyed because we simply do not know when the signal will lead to the next big move. You will occasionally be tossed a bit by the little waves, but when a big wave comes we will be able to ride it all the way in.


Saturday, February 8, 2014

Weekend Update: If That Wasn't a Bear Trap, I Don't Know What Is

I'm going to repeat that title again: If that wasn't a Bear trap then I don't know what is. Because that was nasty this week. It wasn't a full blown hysteria like a real market crash or anything, but this had the makings of blowing up the intermediate term rally (the one that has been going now since November 2012). Monday's trading action was down right brutal; the SP500 traded lower by 43 points or 2.25%, the largest daily loss in over a year, and trust me it was worrisome. Prices sliced through all of our levels of "line-in-the-sand" support and kept on going. I posted this to add some perspective, I stated that this was either just the beginning of a large decline or the end of the short term pullback. The action was simply to violent to be in the middle of a pullback; trading volumes were high, stocks were indiscriminately being sold with both hands, the media was in a tailspin over jobs, emerging markets and the Fed. So either things were really about to get out of hand OR that was a capitulation of sellers and the worst was likely behind us.

Everyone was expecting a correction, it was imminent. Every pullback for the last 18-months has been roughly 5%, but we needed a real pullback around 10% or so, they would say. Well what did the market do? It gave us a 5% pullback at the close last Friday, some people played last year's playbook and did some buying near key support. And here comes Monday morning, it blows through support and takes the pullback to just over 7%. Tuesday morning was a typical "dead cat" type bounce, people that were caught overexposed by Monday's decline took the opportunity to sell into some strength and save face. The Shorts who have been waiting so eagerly for a breakdown loaded up and were ready for the end of the world. But what happened next was the key...

After Tuesday's "hopefully positive" day, Wednesday morning saw the bearish follow-through the Shorts and sidelined Bulls were waiting for. It worked great for 1-hour exactly. The SP500 traded below Monday's low by 2 points, just in case there were anymore weak-hands looking to bail. Once that low was set it never looked back. Trading from a low of 1,737 we then went on to close the week at 1,796 and change. To ignore that a major swing has likely been completed would be dangerous after this week's action. Nobody even cared what the Job's number was this morning, they just bought stocks and squeezed everyone who was left out of position. Shorts had to cover positions, sidelined Bulls had to either watch in disgust (the emotional thing to do) or were forced to buy right back in well above their exit point (the smart thing to do).

We have seen this weekly trading action several times over the past year. Every time it looks like the market is finally ready to rollover, it just holds and comes right back even fiercer. Take a look at the Weekly chart to see examples of this:

Each time the 20 WMA was tested and violated it led to a rally to new highs. If the pattern continues we should see new highs come from this reversal. The Weekly bar for this week and 2 of the prior 3 swing lows above are known in technical analysis as "Hammer Candles".  These bars can tell you a ton about sentiment and how traders were positioning. When something like this occurs, the Bulls have the opportunity to take back the reins.

The nice thing about trading a slightly longer time frame, trading weekly charts as we do, is that we get to sit back and observe this kind of action with a relatively clear head. While the shorter time frame traders are hanging over each day's trading, we can wait for the response to the initial event and determine its longer term implications. It creates a less stressful environment for your life and lets marvelous things like this week's squeeze and noisy distraction play out without affecting our positions in any way.

Keep in mind that just because i told an exciting story certainly doesn't mean the market can't trade lower from here. It can do whatever it wants. We will continue to be mindful of the key support levels and manage risk accordingly.

Let's take a look at our prospects this week as there are some things to briefly discuss.

DDD (reduced to 1/3 holding)
We discussed the drop in DDD midweek. I will be reducing the position down to 1/3 total holding now based on this week's 20 WMA violation. The only viable strength signal active is the longer term RS trend which was tested with this week's sell-off. DDD is a mover, no doubt about it; we rode this up 100% and the subsequent correction took it down 50% from those highs. This will be an interesting one to watch going forward. A correction like this usually takes some time to resolve, I would like to see some consolidation and a base form over the next few months.

HAIN (Added to 2/3 holding)
Hain had a rough week in terms of their trading. After announcing another in a string of record quarterly profits, the stock got whacked due to weaker than expected guidance for next year's EPS. The stock was off 10%+ at the open on Wednesday but managed to recover half of its losses and close above the 20 WMA and both trend support and prior breakout levels. We took this week as an opportunity to add back the portion of our trade that we trimmed on the big extension 3 weeks ago. Price has come back to support and so another 1/3 can be put on here with a stop roughly below this week's close.

CMI  1/3 holding
Cummins announced a decent quarter and initially the stock traded lower on Thursday morning's open. Buyers came rushing in though very soon after taking the stock even higher into Friday's strong close. We now have seen price trade hard into the $122 support level twice after the last two earnings announcements, only to see it hold and bounce right back. Due to that fact of such strong buy support at that level, $122 will now be the stop for our remaining 1/3 position going forward. It is also likely that if this strength can continue we could see price set up again for a 20 WMA breakout and for the RS downtrend to be broken. The Relative Strength trend here is also interesting. It seems to have made a false breakdown in the last two weeks and is attempting to stabilize. If the downtrend can be broken while retaking the uptrend slope as well, we will add right back the 1/3 position. Lets watch this one closely in the coming weeks.


PPG 2/3 holding
PPG played right along with the market this week giving everyone a real nice shake through support. It convincingly broke the uptrend, horizontal and 20 WMA supports, only to stage a comeback and not invalidate a single level. That is impressive resiliency and shows strong interest from investors. I really like PPG above $180.


WFC 2/3 holding
WFC gave its 20 WMA and breakout support a little kiss this week. Both levels held and WFC looks like one of the top Financial stocks to own at this time.


AEP 3/3 holding
AEP, along with the rest of the Utilities struggled this week as the "aggressive trade" may be rekindling on Wall Street. Never the less, the reversal setup is still in motion as price simply retested its breakout level. This still looks like higher prices ahead.


TLT 2/3 holding
As expected the $110 level for TLT acted as resistance this week. After a 5-week surge in Bond prices, it would seem natural for Bonds to cool off a bit and gather themselves before making a real run at that level. If TLT breaks above $110 I would expect stocks to struggle a bit. This will remain front and center in my daily scans and analysis, it should be a high priority signal.


PBW 2/3 holding
PBW looked early on to be attempting to foil us again by slicing though its 20 WMA. It did stabilize mid- week and has now closed only marginally below the line. I am going to tighten the RS trend a bit as I think this depiction better represents the intermediate term rather than the previous support I had in place. I'm watching for a resolution of this higher low, lower high triangle formation and feel the break of that wedge either direction will set the tone for the next significant move.

--
F no position
While we have no position currently in F, I still think it is important to have an idea of what's going on. It appears that the rising wedge formation that we had watched previously has achieved its target objective. The target price for the breakdown also coincided with the longer term horizontal support and the stock found buyers this week. While a bounce from here is most likely, it still has a long way to go to repair the intermediate term damage to its trend. The 20 WMA is declining and there will be trapped Bulls who bought near the highs that will become sellers on advances back into upper resistance at $17. It will be best to be patient here and wait for a more positive looking setup before we get back involved.


UNH no position
There is not much to say about UNH that is different from last week. Price is still below a declining 20 WMA and is in the upper range of the trend channel. This will likely need more time before presenting us with an actionable opportunity.

Wednesday, February 5, 2014

HAIN and DDD: Double Trouble Wednesday

Today was not a good day for our portfolio as HAIN announced weaker than expected Q4 earnings and DDD had a dreaded earnings preannouncement prior to Wednesday's market open. Right out of the gate HAIN was trading lower by roughly 10% while DDD was getting taken to the woodshed, down over 25%. This kind of volatility is enough to churn anyone's stomach and I'm sure you had similar feelings if you own either of these two stocks.

Luckily once the opening damage was done both stocks recovered roughly half of the losses. HAIN is now sitting right on its 20 WMA after bouncing at the $80 support level and DDD has now retraced almost all of its parabolic gains from the end of last year. DDD traded right down to its prior breakout levels near $54 before it found buyers and managed to close back near the $63 area.

While it's painful to watch, I can't emphasize enough how important it is to wait for closing prices before making buy/sell decisions. I know the temptation is to just get out as fast as possible when something like this happens. You just want all that red in your account to go away. The market is an expert of taking your emotions and twisting them just enough to get you to panic into the sell off. The market has made millionaires of those who wait for panic moments to take advantage of shaken, emotional traders. This is why having a plan is so important. There is so much emotion and noise that takes place between the Bells on Wall Street, you cannot allow that noisy volatile time to overwhelm your senses.

Because we are fallible and emotional beings, we need pre determined guidelines to follow for when emotional pressures are triggered. With no plan you would be there selling out your positions to the wolves and there were a lot of sheep out there today being led to slaughter. The market feeds on this emotional release but we cannot be a part of that. If you have a plan you would have watched these declines (in horror I might add), but that's all you would have done is watch. You would wait until your signal actually triggers whether it's on a daily closing basis or weekly basis. What you would have gotten out of that was saving your account roughly 5 and 10% respectively in each of these names from open to close.

As you know I trade weekly signals which means I wait for Monday through Friday's trading to determine if a position is still valid or not. If come Friday, my signals are failing, then I will make my sell decision. Some might say that's taking excessive risk and foolish. Well I have studied these events and looked at the probabilities. Through my research I have discovered that these events tend to be outliers in an overall successful strategy. If you only position yourself for outlier events you will miss 98% of the normal action.  With a plan in place your success will not be based on these "one off" type events, sure they are gut wrenching, but you have to be able to sit through some volatility if you are going to have success in the stock market.

I will be waiting to see how this action shakes out in the next couple days, just as I discussed dealing with the volatility in the SP500 after Monday's rout. I wait for weekly closing prices; I am an intermediate term trader and those are part of my rules. This helps keep my emotions in check and keeps me positioned based on the weekly timeframe. Some people need to be more reactionary with their trades and trade daily time frames, and that's fine, there is nothing wrong with that. But whatever plan you have for managing risk, do make sure you follow that plan when emotions get the hottest.

Could these stocks continue to trade lower into the end of the week? Sure they could, but they could also manage to stabilize and remain valid positions for us going forward. Do not mistake my "weekly closing price trigger" for complacency around these volatile events. Quite the opposite really. My plan allows me to view these events without emotions and makes my decision extremely clear as we head into Fridays close. Bottom line if DDD stays where it is here it will signal a partial sale due to the 20 WMA invalidation, but HAIN could still remain a perfectly valid position as it is still holding all support signals I follow. Let's watch and see what happens.

Monday, February 3, 2014

This is Either the Beginning or the End

In case you missed it, today's market action was pretty god awful. The SP500 made a run at taking out ALL intermediate term support levels and did it in convincing fashion. Two things usually come from action like today's:

1. This is the beginning of much more weakness to come in stocks going forward.
OR
2. This is a capitulation trade and has more or less exhausted the selling pressure. 

This sort of action is exactly why I trade weekly charts, levels and closes. When I see a day like today the natural inclination is dump everything along with the herd. But it is almost always better to see how prices respond in the subsequent days that follow to better assess the prior two outcomes stated above; we refer to this as confirmation follow-through. Typically the market will do its best to fool as many as possible and these kind of sessions can often be traps set by the market to get you to react exactly how you should not at exactly the worst moment.

Waiting for the weekly close of prices allows us to maintain our composure on a day like this.   Managing on a weekly timeframe will still get you out of the way if this turns into something really bad and it will keep you in long enough to see how price responds to whether this is the beginning of the move or the end.  

I am very interested to see how this plays out in the coming days. There will be plenty of Fed stimulus in the next couple days as well as the January Jobs Report on Friday. These will likely provide the ammo to either fuel the downswing or stop it right in its tracks.

If this in fact is the Beginning of a much weaker market we will know by the end of the week and will likely be headed down to long term support near 1,600. If this is merely a "bear trap" then we should see prices firm up substantially and retake the key support levels by Friday's close.

The bottom line after a big selloff like this is to not panic or do anything drastic based on one day's worth of action. Don't dump your winning stocks into the initial swoon and don't be too eager to buy the dip. The market is in "show me" mode now and my trading activity is currently on hold. If prices stay around the lows throughout the end of the week THEN I will likely have stops triggered and exit those positions. If the market can stabilize and rally back, we will have to see how much damage was repaired and whether our stocks were able to hang on.

This is the first real assault of the intermediate term uptrend and 20 WMA in the last year. We did see a shakeout selloff in early summer, but the market was able to hold and rally right back. If this does not happen quickly we will be forced to take defensive action come week's end.   


Saturday, February 1, 2014

Weekend Update: Watch List Stocks updated

In case you haven't noticed the market has gotten a bit choppy and wild to start 2014 and especially in the past couple weeks. Q4 earnings haven't exactly knocked the cover off the ball and Emerging Market worries are starting to creep up quickly. But despite these concerns, US Markets continue to hold key intermediate term support levels; especially our first "line in the sand" at 1,767 continues to find buyers. My purely anecdotal observation is that market followers have gotten rather negative toward stocks over the past couple weeks. We have seen profit taking since the beginning of the year, but that is expected after such a strong previous year. Investors hold winning positions into the new year so they can push back their tax payments until 2015. This fairly normal reaction has been explained by the media in terms of a Turkey/Emerging Markets currency crisis and reduction of Fed stimulus. While these concerns should not be ignored (especially future Fed tightening), we are still not even through the FIRST key support level! This is a very important lesson to understand: resistance is resistance until broken, support is support until broken. So far support is still acting as support yet the media is widely convinced that we should expect a 10-15% imminent correction. This correction may come to pass, but we have to break support first. So keep an eye on 1,767 going forward.


As per our year end review discussions, I have adjusted our Top 10 watchlist stocks for 2014 as I felt fewer total holdings would be better (dropping the 9 Sector ETF's) and we did not have each sector represented equally in our prior list. We held two energy stocks and two Consumer Discretionary stocks, while not having a Health Care or Utility stock. For our list going forward these will be the stocks I will be following based on fundamental strength, technical setup and key investing themes for the future. AAPL, ENB, and HD have been exited as of Friday's close based on failing technical signals and portfolio re-balance.

Financials-                       Wells Fargo Bank (WFC)
Consumer Discretionary-  Ford (F)
Technology-                     3D Systems (DDD)
Industrials-                       Cummins Engines (CMI)
Energy-                            Clean Energy (PBW)
Materials -                       PPG Industries (PPG)
Health Care-                    United Health Care (UNH)
Consumer Staples-           Hain Celestial (HAIN)
Utilities-                           American Electric Power (AEP)
Bonds-                            Treasury Bonds (TLT)


We have also made some small adjustments to how we position size our holdings based on signals of strength. Lets take a look at each holding and see where the Blog Portfolio is invested as of the close of trading Friday, January 31st.

Wells Fargo Bank (WFC) 2/3 holding
WFC has shown strong trend strength over the past couple years and we have two actionable signals suggesting more positive price action. Price is above the rising 20 WMA and Relative Strength is still in its longer term uptrend. There are currently no price patterns in play here so we have 2 out of 3 actionable signals and therefore hold 2/3 of a position. To take us out of our positions here we would need to see the RS trend fail and for price to break the 20 WMA while taking out the low just under the average at $43.20.


Ford (F) 0/3 holding
We exited F some time ago as it was failing our trend strength signals. Since that time it has continued to trade lower after a failed bounce back attempt that retested the underside of the now declining 20 WMA. Ford has built a case for more weakness in the near future. I still like the long term setup here and the cheap valuation, but we will just have to wait for more positive price action before getting back involved.

3D Systems (DDD) 2/3 holding
DDD was a monster performer in 2013, 2014 however has been decidedly different. We took gains out of the stock as it continued to make new highs and just this week I added back some of the prior holdings we had previously. While this could certainly continue lower, a retest of the 20 WMA after a $20 decline is enough for me to take a little nibble. I am holding a 2/3 position for DDD based on the long term RS uptrend and price above the rising 20 WMA. We don't have an active price pattern in play, so we will have to wait for further formations to add once again to our holdings.

*Note: For a stock that is this volatile, a full position of DDD is not the same size as WFC or AEP for example. Due to is wild swings I tend to keep my maximum position size somewhere in the 50-75%  range vs. a slower moving stock. For example, if our regular "full position size" is $10,000, DDD would max out around 5,000-7,000 depending on your particular risk parameters. I tend to lean somewhere around 60% of the regular maximum size, for a reference point.

Cummins Engines (CMI) 1/3 holding
Cummins was looking like it really wanted to push higher but has since failed its new high breakout. It is now trading below the 20 WMA and Relative Strength is looking weak as well, breaking below the 18-month support line. We still however have a positive suggesting price pattern in play. The Cup/Handle setup here still suggests price is in a bullish long term posture and we would need to see the uptrend line broken and lows near $105 taken out before this pattern is killed off. As of now the pattern has a price target near the upper $160's. We maintain a 1/3 position to capitalize on this price formation.

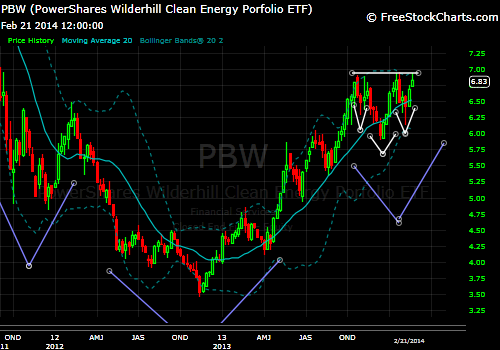
Clean Energy (PBW) 2/3 holding
Of the two Energy investments on our watchlist I chose to keep the Clean Energy Fund (PBW) and gave Enbridge (ENB) the boot. This is only based on fact that I think renewable energy is the future; the clean energy sector seems to be finding a possible generational bottom in prices. I like ENB also though, it is trading just off its all time highs and seems likely to resume its uptrend in the future. If anything were to happen to the health of PBW, ENB will be the replacement in the future.

The chart here looks fine, we still had a series of higher highs and higher lows when we took our exit signal a couple months ago. That has now shown to have been a shakeout move and the stock has attempted to move higher. We have the start of what looks to be an even larger reversal Head/Shoulder pattern in the works, although the right shoulder is much shallower than I would like, a break above $7 sets this pattern into motion. We do still have 2 signals in play currently as price has managed to retake and hold the 20 WMA as well as a longer term up trending Relative Strength trend line. Due to the overall uptrend we need to use the swing low at $5.89 as our trailing stop. We have seen twice in the last year where a correction will pullback just enough to close below the 20 WMA only to turn and go right back higher. To help avoid another shakeout we will be watching those lows for confirmation that a more conservative posture is needed.


PPG Industries (PPG) 2/3 holding
PPG has continued to produce a solid and steady uptrend. After a two week "cool down" some buyers have resurfaced right at key support. We hold a 2/3 position as price is above the rising 20 WMA and longer term RS trend is intact. We will look to reduce our holdings if the $180 support cannot hold and/or the Relative Strength uptrend fails.

United Health Care (UNH) 0/3 holding
I chose UNH as our new Health Care stock for 2014 due to its long term price strength and its extremely favorable fundamental valuation. UNH is the "cheapest" of the Health Care sector top holdings, yet it continues to make new all time highs in a steady uptrend. At this exact moment however we have no actionable signals based on our plan. What is also notable is that price is trading just off the upper range of the 5-year uptrend. The plan will be of course to continue to watch for our signals to trigger and hopefully price will retrace back in line with uptrend support. That would present a very nice place to look for entries in the name.

One more item to note is the RS trend. While technically in an uptrend vs the SP500, it was unable to make a new relative high on the latest price advance. The Relative chart formed a "Double Top" looking signal as price topped out and has struggled since. This will be an interesting level to watch going forward. Although a move back to the lower trend support would be welcomed as well. Currently its below the highs and above the lows UNH is kind of in no man's land here and we will watch and wait for more confirmation.

Hain Celestial (HAIN) 1/3 holding
HAIN just keeps chugging along, but as I have stated previously, the stock likes to "pop and consolidate". We recently got an overbought reading after the big surge 2 weeks ago and reduced our 20 WMA position as a retracement was likely. When prices become over extended above the 20 WMA I see those as profit taking opportunities and reduce my holdings. When price corrects back in line with the average I will put that portion back on. Currently we have only one valid signal and that's the ever steady RS uptrend. We have no active price patterns as the Cup target we traded for the second half of the year was acquired on that big surge rally as well.

Hain gets a 1/3 holding right now, but on a pullback to the 20 WMA I will add back that portion. And this is more trading than some will prefer to do, there is no law that says you have to take profits on these quick moves; the trend is higher, the stock behaves orderly and continues to set new highs in prices continuously. I will highlight these "profit opportunities" but if you are more comfortable holding and following the overall trend, that is not a problem with me.

American Electric Power (AEP) 3/3 holding
Our new Utility holding will start with a boom. AEP, as of this week's close, triggered all 3 of our strength signals. Price has broken to new multi-week highs with an up turned 20 WMA, Relative Strength vs the SP500 has broken out of its 8-month downtrend, and a reversal price pattern has triggered.

AEP has confirmed a reversal Head/Shoulder bottom and has convincingly broken above the neckline resistance on strong volume. The price target for this pattern is at roughly $53.80, over 10% from current levels. We would at that time look to take gains on that 1/3 position dedicated to pattern formations and maintain our other 2/3 holding. The stop on new positions here is below the $45.50 right shoulder lows. A move below that level would suggest this was a false signal and we would wait for another.

The fact that Utilities are so strong here suggests weakness for the overall market is likely. The Utility ETF, XLU was a poor performer last year relative to the market but has seen solid fund flows to start 2014. When investors move to Utilities they are seeking yield in an uncertain environment, currently we are seeing this taking place; AEP pays an annual dividend of over 4%. That is a nice consolation prize for our holding even if nothing comes from this setup. AEP is cheap relative to its peers, pays a solid annual dividend and has been a strong and steady performer.

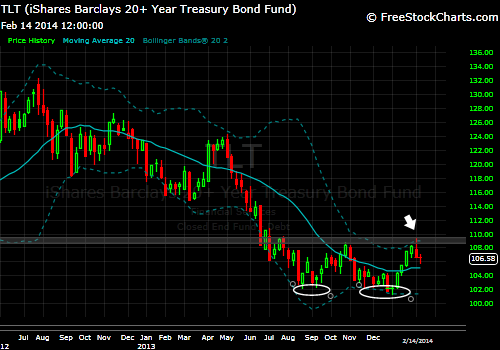
Treasury Bonds (TLT) 2/3 holding
The other group that investors flock to when trouble starts to creep into the market is Treasury Bonds. We currently have a 2/3 position in the TLT as it is suggesting intermediate term strength. We have price above the rising 20 WMA and RS trend has broken to the upside after lagging the market for almost 18-months. If we can see a break above the 109-110 resistance area, it will trigger the Double Bottom formation seen above and we will add an additional 1/3 position for that trade opportunity. This will be a crucial level for Bonds and Stocks, yet I take my signals as they come and we have 2 currently in motion. A breakout above the prior highs will likely have broad market implications and will be something to watch closely.

TLT will be used in our portfolio as a hedge for our open holdings when the market suggests trouble ahead. I feel this is a more appropriate method to gain protective exposure rather than Shorting. I originally intended this blog to be simple for folks to follow and trade along with, adding short exposure goes outside the bounds of simple investment strategy. I will do my best to keep things as simple and clear as possible, so TLT will act as our "anti-stock" trading vehicle going forward.


---Our 10 watch list stocks are fundamentally and technically strong, and most fall in the upper range of overall sector fundamental score. All have promising long term uptrends and/or trading momentum.

 Clean Energy, CMI and HAIN fall into my themed based trading portion. I believe renewable resources will continue to grow making PBW a solid likely performer. CMI is a transportation play on the natural gas boom, and HAIN represents the healthy eating movement. I feel these are areas of strong growth in the future.

UNH and AEP are our new editions to make sure we are representing each sector of the market equally. Both have leading sector fundamental scores and are in strong and steady long-term uptrends.

DDD and PPG are sector leaders in terms of  product innovation and have shown strong long term returns. These are not what would be considered "cheap" by any metric, but sometimes you have to go with Relative Strength in a portion of your portfolio.

F and WFC are strong "American economic recovery" plays and represent consumer demand. WFC should be strong based on loan growth and US housing. F has been a leader in new car sales and has moved toward more energy efficient vehicles. Both should be in high demand should the job market recovery continue in its upward trajectory.

TLT (Treasury Bonds) will be our market protection portion of the portfolio. As Bonds signal buys we will use those signals to hedge our market exposure as conditions are likely suggesting elevated risk levels.

That leaves us with 10 holdings and represents a really nice mix of value, dividends, growth and relative strength. All in all, I would be hard pressed to come up with another mix of stocks that cover all of these metrics better. 

--Fortunately we have been given a nice grace from Mr. Market by pulling back this week making portfolio adjustments easier. These adjustments will be made for next week's trading as this is how price and trend suggest we position our Portfolio going forward. This will be subject to possible adjustments each week if the market moves swiftly lower through key support levels. For now however we continue to hold the line and our holdings look solid going forward.