As we discussed last week the ball was in the Bulls court. They had been able to recover the first major support zone and now we needed to see if they could continue to push the market back to the upside. When a "Hammer" pattern is formed like we saw with last week's trading, the pattern is not confirmed until there is confirmation follow-through on the next bar on the chart. Take a look at this:
There was strong follow-through this week as the SP500 is now testing its all-time highs. We have seen this trading action before during this rally and each time this has lead to higher highs. So far this is the best result we could have hoped for in terms of the health of the uptrend. Good stuff!
It appears the market is still following last year's playbook and the Bulls are leading the way. This is why its not a good idea to get too antsy to sell during a bull market; there will be shakeout attempts along the way, that's what keeps the rally sustained. We are still seeing the market set up the Bears to be annihilated. Every time the Bears think they have an edge and press their bets the market comes through and scorches them. This is still working on the psychology of investors and will eventually lead to the slaughter of the Bulls as at some point these bounce backs will not occur. This will leave most in disbelief and the market will correct, taking them with it. Which is exactly why we will continue to acknowledge each signal we receive because we simply do not know when the next truly big move will occur. But by following our trend signals we will always be warned in advance by the market when a major shift is underway.
I want to update our trend channel for the SP500 chart. We have seen three Hammer type reaction lows over the last 8-10 months and i feel those will be the most important lows to watch. Here is what it will look like:
This new trend support connects exactly with the three tests lower and each low was a shakeout attempt as they all breached the 20 WMA on an intra-week basis only to see buyers return in force. The very idea of strong support is identifying where real buy interest will be. So far the most impactful support has come from these lows. In my opinion this has become the support to follow moving forward.
--
Since we only had one adjustment for the Portfolio this week where we added to CMI
(here), I think this would be a good week to take a look at the market internals and see which sector groups are performing well and which are showing weakness.
Financials XLF
Financials have performed average relative to the market over the past couple months, some ups some downs. They have managed to hold the prior breakout, now support at $21. Once the 20 WMA was violated prices were able to stop and bounce right back. XLF is okay right here, but we will need to see trend support continue to hold up.
Discretionary XLY
Discretionary has been a close focus of mine to begin the new year. So far it has been fairly unimpressive but still seems like the uptrend is intact and the relative uptrend is still fine. Since it has retaken the support at $64 I think it is fine at this point.
Technology XLK
Technology closed at a new high this week and has been a solid relative performer year to date. Everything to like here above $34.
Industrials XLI
Industrials have shown some vulnerability yet prices never violated key support. The RS trend is back testing support, but as long as the uptrend is intact I like this group.
Materials XLB
Materials made a new weekly closing high this week but relative to the market XLB is simply performing in line. The support at $43 has held on this test and this still points higher above that level.
Energy XLE
Energy has definitely been a laggard to begin 2014. The bounce back rally over the last two weeks hasn't even been able to retake the now rolling over 20 WMA. Price also is on the underside of the uptrend support going back over 18 months. If you are Long Energy names, it is time to watch them very closely. If the low at $82 fails I would not want anything to do with this space.
Staples XLP
Staples are a mess right here. When looking at this chart I had a hard time seeing anything truly positive or negative. Price has not been able to retake the 20 WMA but the short-term support has held on the correction. Relative to the market Staples have been very weak and price is forming what looks like a broadening pattern. Each swing in price moves further from the last move and prices become more volatile. This is an area to avoid right now.
Health Care XLV
Health Care has been a beast. Still leading the market, still making new highs, and still dramatically outperforming. This is a great area to be looking for setups if you are trading this market. The Biotech area especially has been strong.
Utilities XLU
With all the media talk about corrections and bounces this week nobody said anything about the strength Utilities are showing. XLU broke out in a big way this week both on a relative and price basis. This breakout for the sector lagged our breakout entry into AEP two weeks ago, so this only reinforces the likelihood that our AEP position is setup for much more upside to come. Utilities however don't typically outperform during strong market rallies, so seeing this happen at this point is interesting and will bear close watching in the coming weeks.
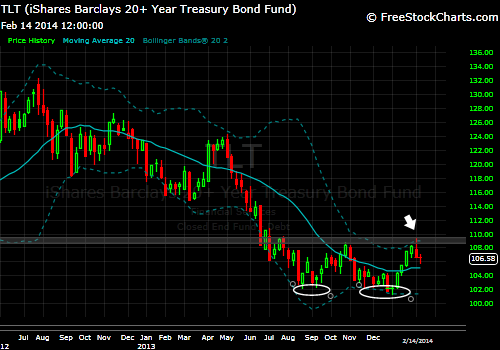
20+ Treasury Bonds TLT
The TLT was once again thwarted at the $110 resistance level. We knew this would be the crucial inflection point for risky assets over the near term. While this test and failure does not kill off the possibility of a strong rally in Bonds, it does create a situation that will need to be monitored very closely as we go ahead. The two key points will be the resistance at $110 and then the 20 WMA support with the consolidation breakout zone since the end of last November. Basically any movement between $110-104 is more or less meaningless and it will take a break of either of those price ranges to indicate where the next move is headed.
Gold GLD

Gold was able to breakout strongly this week and short term the momentum seems to be there. You can see the relative breakout vs the market recently as well as price retaking the 20 WMA. We have not seen the 20 WMA turn upward yet and price has still not made a higher high in this larger downtrend. I definitely would not want to be Short here, but I also would not be interested in going Long just yet either. This will take a little more time to play out if the lows are in place for Gold. Don't worry, if Gold can make a higher high, there will still be plenty of time to participate in the upside that could follow. In fact there does seem to be a double bottom pattern formed currently from the lows in June and December of last year. For this pattern to complete however we would need to see price break above the rally high between the two lows at about $138. At that point there would be a nearly $20 price pattern in motion and would then have made not only one, but two successive higher highs. At that point we could say the bottom was in for prices; currently I am not completely convinced the long term downtrend is over
--An interesting note on the XLU, TLT and GLD:
These 3 asset classes, Utilities, Treasury Bonds and Gold, are all acting as though more QE is on the way from the fed and interest rates are still headed lower. Here is my rational for this idea:
Utilities show strength (see positive fund flows) when investors seek yield and/or safety. Investors seek dividend paying stocks when interest rates on more safe savings accounts are low; they still need to make a steady return on their money but they are risk adverse and seek steady, safe equities.
Treasury Bonds perform inversely to interest rates, if rates go lower, bond prices go higher...simple. What is also of note is that when the Fed is providing stimulus and buying Bonds, Bond prices will be supported. Investors also seek Bonds in times of worry as they are safer than stocks during a downturn in the economy.
Gold is a fear and inflation trade. When Gold is moving higher it means investors have more fear in something bad happening and/or they believe inflation will rise in the near future. Inflation (at least the theory goes) increases when the Fed prints more money for stimulus. More dollars with the same tangible government net worth creates dollars that are worth less than they were before additional was printed.
I think it is fascinating that these three groups are showing positive signals currently. It is possible that this will not play out and stocks will roar back. But it is also something we need to see develop to determine if the strength being shown in these groups will be reflected inversely in stocks as is usually the case. Each of these groups thrive relative to the market when stocks are weak. The big moves in Gold and Utilities this week along with the broader markets suggests something is moving under the surface with either weaker stock prices to come or more easy money from the fed. Treasuries acted as you would expect on a strong stock market week, they traded lower in the normal fashion. It will be interesting to watch this develop over the coming weeks and I will keep you posted on any new developments.


No comments:
Post a Comment