As was reasonable, markets traded more or less sideways this week after the prior strong two weeks. The market finds itself at an interesting decision point. While price is again testing all-time highs, the internals of the market are slipping a bit and appear mixed. Utilities are the leading sector year-to-date, Gold and Bonds continue to see positive fund flows, and the number of stocks participating in each rally continues to decline with each bounce attempt. When the market makes new highs we want to see more stocks in uptrends than on the previous new high attempts, if fewer stocks are showing strength as the market continues higher it means less leading stocks are powering the broad market advance. This is called a negative divergence and we would want to see this correct itself before the market runs away too much from here.

There will no doubt be a bit of "Double Top" talk this weekend and into next week, but until we see a weekly close below 1,775 that will just be noise and we have to assume new highs are still the most likely outcome.
We had no changes to the Portfolio this week so I want to take a look at our holdings and determine which ones look the strongest at this current point. We will rank them 1-10 to see if we are positioned correctly according to strength.
1. CMI 3/3
CMI currently gets our #1 ranking for strength. Despite the strong surge the past two weeks it once again posted a positive week and most importantly CMI continues to make higher highs while the market has not. New all-time highs, relative outperformance vs the SP500, and strong price action give CMI our top billing.
2. AEP 3/3
Coming in at a close 2nd is our Utility holding AEP. This just continues to rip since breaking out from its consolidation base a month ago and is now about to challenge its all-time highs going back nearly 20 years. There should be significant resistance around 51-53, but a move through that range would be very positive.
The measured target for the inverse head/shoulder pattern is $53.50, so momentum certainly favors a run at the highs.
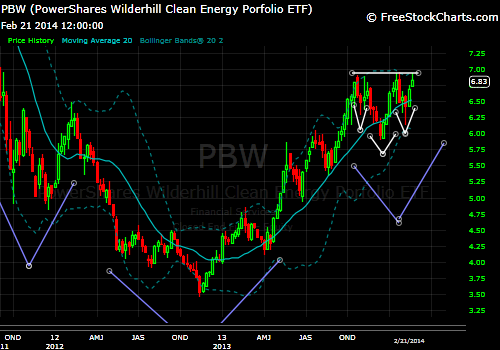
3. PBW 2/3
Clean Energy needs to be watched closely here. We have been tracking the large reversal base that has been under formation (blue lines), but now we have a nicely developed smaller pattern to act as the catalyst for the larger breakout. Here is a closer look at the latest formation:
This is the Daily chart for Clean Energy showing the zoomed in view. I will be watching for a weekly closing price to breakout above the January highs. If/When this breaks out we will add another 1/3 position to align ourselves for the rally.
It is a positive thing to see where one bullish setup leads to another and so on. We have seen this continuously in PBW. And once again we see its favorite pattern developing.
Even though the new smaller pattern here will target the $8 area, we will be trading the larger setup on the same breakout and targeting the $10.40 level for our position.
And above another possible setup (yellow) that could be formed by the completion and pullback of the current formation (blue). This is how a long-term support base is built. None of this has to play out of course, but if I was drawing the road map for how this is setup going forward, this is how I would do it. All I see and have seen over the past year+ is positive price action and fund flows. I currently see no reason for this trend to slow over the next 5-10 years. I like what I see here on every timeframe! That's a fun thing to watch.
4.PPG 2/3
PPG has been able to hold right near all time highs. It has been an in-line performer vs SP500 over the past several months but a breakout to new highs confirmed by a breakout Relative to the market would set this up for another leg higher. PPG looks strong here. There will be a solid support base built off of $180 and should be an area of interest on any future weakness. Above $180 its Long and strong!
5. WFC 2/3
Wells and the rest of the Financials have been slow to tag along recently. Support is still holding and WFC is at all-time highs, so nothing too bad is going on here. I will really want to see the trend Relative to the market hold this support test coming up to believe that the Financials are not ready to correct significantly. 6 of the 10 XLF Top 10 holdings are trading weakly and below their 20 WMA's, and none of the strong 4 performed well in the last couple weeks. BAC has been flat to lower and USB, AMX, and WFC have all failed to make higher highs on this most recent bounce.
If the market is really going to become weaker, the Financials will likely lead the way on the downside. This will be a space to watch closely in the coming weeks.
6. HAIN 2/3
Hain continues to trade heavy following its most recent earnings announcement, yet is also continues to hold all intermediate term support levels. The $80 level has acted as a spring board when ever it was tested, and on a weekly closing basis prices have not ended below $84. The uptrend line both in price and Relative continues to hold and see buyers. Hain is at a place reward/risk ratio is as good as it gets. We will know really quickly if this wants to turn down and roll over. A weekly close below $84 will likely be the signal that the rally needs a break.
7. DDD 1/3
Man this thing can whip around! DDD added another 9.4% this week and is now off the correction lows by nearly 48%...48% gain in 2 weeks! This is exactly the reason I wanted to not trade an all-in all-out method and decided to involve a scaling method to my holdings. An all-in all-out method would have likely had me exit my entire position at the $66 close 3 weeks ago. But with the individual signal method we were still able to maintain half of our remaining position based on the strong Relative uptrend, and therefore continue to participate in this recent surge. While we didn't make as much as we could have, we didn't dump the entire holding and have to watch this run away either.
Currently I don't really know what to do with this stock. It has managed to jump right back above the 20 WMA, but also has the look of putting in a sort of Head/Shoulder Top formation. I really need to see some consolidation before I want to increase my exposure. Basically a 50% smack down in a 5-week period, followed by a 48% snap back bounce in two weeks doesn't exactly set the stage for sound risk management. We will stay small in our positioning and just let this run around until we have some form of solid support base to proceed further from.
8. TLT 2/3
Treasury Bonds are still working on that Double Bottom formation. There has been some mild consolidation over the last couple weeks and if price is going to make a run at the prior swing highs it will likely do so from close to current levels. I would expect the 20 WMA to hold and for another leg higher in the coming weeks. Again I feel a break above 109-110 on a weekly basis would be poor sign for risky assets.
9. UNH 0/3
UNH is just hanging out, chopping sideways. We have seen price retake the rising 20 WMA, but it has not made a new high above the prior weekly closing range. It will need to take out the prior closing highs near $75 along with a Relative breakout to signal an entry. Its close and I like the setup, but it just needs some more time.
10. F 0/3
F is in an intermediate term downtrend. The channel is well defined and the 20 WMA has a fairly aggressive down slope. If $14.40 fails to hold as support, the next area of interest comes in around $12. Weak price action abounds and we will stay away until support can hold and then reverse the current downtrend.
----
All in all I would say we are positioned correctly considering the current strength and weakness in our Portfolio. Herein lies the issue with a small, focused watch list; we simply have to be patient and wait through dry spells until some if our stocks regather themselves. If we used a wider list to draw from we could likely still find plenty of setups to occupy our funds. That is the downside of following a narrow list like we do, but there are positives as well.
By only watching 10 stocks (1 from each sector group), it gives us a pretty good idea of how aggressive we should be positioned in any market environment; our individual stocks will tell us when to be in and when to be sidelined. Due to the weakness in a few areas we are holding roughly 50% of our funds in stocks at the moment, 10% Bonds and 40% in cash. With a market that is showing weakening internals while trading at all-time highs, I think it is interesting that by following our 10 holdings we are positioned more neutral at the moment. We are not heavy stocks, we are slightly overweight but not by much. We have a little nibble of Bond exposure as they have corrected substantially over the past year. We also hold a solid amount of cash in our account as portfolio protection near market highs and as an opportunity should conditions improve and our lagging stocks signal entries.


No comments:
Post a Comment