Monthly Bull Flag > 239.25
The monthly trend has been just massive in NVDA, but that doesn't mean its over yet. Price has digested for multiple months at the highs and is now rotating higher. Its possible we could see a similar reaction to the pattern in mid-2017.
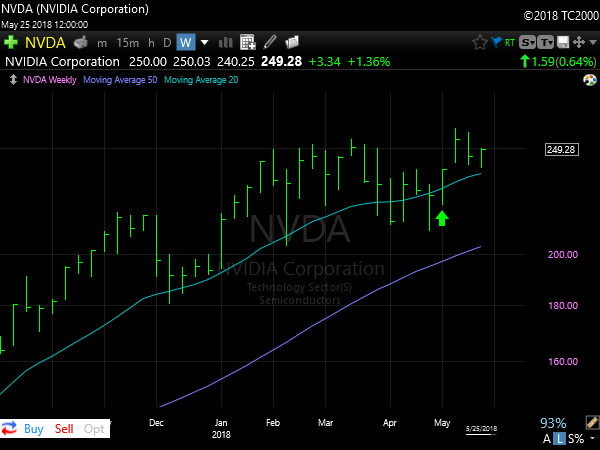
Weekly breakout + 3 week digestion
The stock made new all-time highs recently, in anticipation of its earnings it ran $50 off its low in 3-weeks time. Once the earnings came out (they crushed every metric) the stock just sorta hung out and has been coiling orderly since.
Daily ABC/Bull Flag + Outside/Up day then a 2-day grind higher
Zooming in on the recent consolidation, it looks very normal after the large ramp. It filled the 5/4 gap for all intents and purposes after making an ABC pullback type pattern, and has now rotated off the low with a bullish Outside bar.
Also note the last two days into the holiday weekend the broad market faded lower, while NVDA closed higher both days. Showing some added Relative Strength there.
Hourly Downtrend breakout + Divergence on Double Bottom, then follow-through
Looking to the Hourly view we see the downtrend breakout which came off of a lower low/Double Bottom pattern with a positively diverging momentum reading. Price has since worked its way higher showing follow-through instead of a quick fail.
As long as prices hold the low from 5/23 I will be very long and looking for an upward expansion back to new all-time highs.