It is becoming increasingly noticeable how jittery market participants are at these levels, its the "one foot out the door" mentality. We have seen this for a while now; as soon as the market suffers a down week, market participants get extremely negative very quickly. What this causes however are sharp snap back rallies once the selling subsides.
I'm taking two things away from the trading action this week:
1. Many Market participants are incredibly edgy and are looking for any excuse to sell
2. Weakness continues to be bought at the slightest sign of exhaustion
What these dueling ideas create are sharp violent counter trend moves as traders begin to pile on in the face of any market weakness. But then the weakness is quickly absorbed as soon as short-term sentiment gets overly negative and support creates fast, snap-back rallies.
In markets like this you have to be open to the idea that volatility increasing can lead to a larger correction if a bounce back doesn't occur. But at the same time you need to be sure the trend is failing before you abandon ship as well. I like to lengthen my time frames and give my winning trades plenty of room during these choppy volatile environments. That sometimes means reducing trade sizes to account for the added volatility and outright cutting weakening holdings that don't bounce back as quickly with the overall market.
Some shorter term traders will tighten their stop levels when the environment gets choppy, therefore protecting their near term gains. However in this market it has not paid to get too negative too quickly which is why I prefer to place my stop levels well outside the range of "normal" market noise.
That being the case, despite the movement up and down recently we have only made very small changes to our holdings over the past couple weeks. I have added a new position in GOOG and BMY, and also have exited SBUX due to its general lack of strength.
For the most part our positions are still well out of harms way and it would take a meaningful market breakdown to shake too much of our conviction at these levels.
-Exit SBUX

I still like the setup here provided the lows at $68 remain intact. A break back above $79 would suggest the uptrend is resuming and I would want to renter at that time. Unfortunately now we need to step aside and pass the risk to someone else.
+Enter GOOG

Price broke out to a higher high last week and now sets up the favorable entry point I look for. I love how the rising 20 WMA has cupped the price action during the last consolidation, that provides the launch pad for a new trend higher.
Should the consolidation area fail to hold as support, this breakout would be in trouble and we would not want to be holders below $566 on a weekly basis. But above that support, I like the chances of GOOG going much higher.
+Enter BMY
 Bristol Meyers has undergone a lengthy consolidation/correction and now appears to be ready to move back higher. Last week price was able to break to a new 25-week high and Relative Strength confirmed by breaking its downtrend resistance. Pretty simple trigger from my view. Stops can be placed below the swing low point at $49 which makes this a very favorable entry.
Chart of the Week
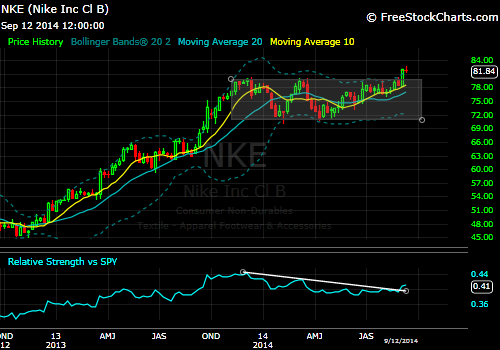
Nike (NKE)

While the market was freaking everyone out with its poor trading action, NKE exploded to new all time highs. After announcing a blow out earnings quarter and strong projected sales growth, shares rallied over 12% Friday.
This setup looks surprisingly similar to the way TWX did after the rumored buyout offer from Fox. In that case I reduced my exposure by half after the news broke. But with NKE this is a very different situation in my opinion. I am not a seller here and this is one case where I look to a fundamental indication of the stock's reaction. A rumored deal is not the same as increased organic growth and increased EPS. NKE's rally was in response to strong company performance, while TWX was a rumored merger from an outside party. I make a point to reduce exposure on M&A rumors as they offen create a disappointing final outcome for the stock. However a strong change in company earnings expectations can be a catalyst to propel the stock for multiple months if not more. So while I rarely pay much attention to actual company news for my risk management, this is a case where the story can influence the thought process slightly.
Stops should be adjusted to just below the breakout low and 10 WMA at 79.75. Above that and we are hanging on for the ride.