It was a good week for the markets with the SP500 gaining +2.6%. While it was nice to see the SP500 participate, many stocks have been working consistently for some time now. The start of 2015 has been a great one for Relative Strength stock pickers. If you are able to identify quality setups in strong stocks then you are likely outperforming the major averages. If you have been fighting the trend and attempting to call tops, then you are no doubt in a bit of performance trouble (and its only March).
One stock I have been watching closely is Facebook (FB). This week we are getting an entry signal for our Lg-Cap portfolio. There has been tremendous doubt surrounding this company after its botched IPO in 2012. But after causing quite a bit of anxiety for shareholders early on, FB has become a huge winner since mid-2013.
+Entering
Facebook (FB)
This is exactly what I like to see: A multi-month consolidation at all-time highs. While the stock has been pretty volatile within the range, over the past month or so it has been able to hold near the range highs.
You can see above how in both October and December when the upper range was tested the stock was quickly, and harshly rejected from the highs. On each of these rejections however price managed to rally back a little sooner, creating some modest higher lows. The most recent test in early February only managed to pull back to the $78 area. That, along with the relatively tight trading range (between $81 and $78) over the past 3 weeks gave a hint to what happened this week.
When a stock is trading sideways in a range but then begins to tighten its range and hold near the upper end of the consolidation, its a sign that an upside resolution is likely. We are seeing that resolution right now. Facebook closed the week at new all-time highs. This signals our entry.
We can place our stops just below the tighter range and 20 WMA at $78. This gives our entry a fantastic risk/reward and we will continue to hold our position until that support is violated.
+Entering
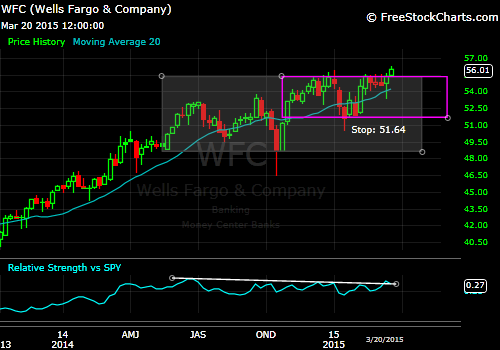
Wells Fargo (WFC)
An old favorite of our Lg-Cap portfolio, WFC makes yet another appearance. We've seen a solid consolidation over the past year and this week's breakout to new highs tells us all we need to know.
We can use the swing low at $51.64 as our initial stop for now. You can see that similar to FB, WFC has been able to tighten its trading range recently and has pushed through its highs. This stuff works folks. This pattern repeats all the time across markets on all timeframes. Its powerful and high probability.
I believe that we will be able to trail stops pretty quickly to the $54 area should we continue to see upside follow-through away from this trading range.
Trailing Stops for
UNH
Differing from the examples above, UNH is nowhere near a long-term support base and continues to trade vertically. But we don't pick tops, we simply run with the stock and trail stops as areas present themselves. I believe the $106 area represents a good place to do so. It coincides with the swing low from January and now the 20 WMA has caught up.
we can see this area better on the Daily chart:
The daily view shows an even tighter swing low near 112.50, and that will likely be our next trailing stop. For now we want to stay a bit away and give UNH some extra room. In fact I would be interested in being a buyer near this 106 area should we see weakness of that magnitude.
We are still giving the stock more than a 10% cushion to move around and I think any movement above this level is just noise. This is our longest current holding and biggest gainer. We want to give it the benefit of the doubt before we bail on this excellent winner.
Time Warner closes at 13-year Highs
I wanted to highlight a positive development for TWX. It has broken above its prior highs and has closed at its highest level since 2002:
I discussed the bullish posture on social media all week as it continued to take out prior highs. This Friday's close triggers the weekly "cup/handle" formation that has been under construction for almost a year. Initial targets for this pattern are in the $108 area, or 25% above current prices.
We are keeping stops where they are for now, but this is developing into a very nice looking stock to own going forward.
Growth Stocks Have been Market Leaders
Investors have been bidding up companies showing strong Earnings and Sales growth. In fact Ive been seeing many names coming out of large consolidations recently, and behaving well despite the broad market volatility.
Thermo Fisher Scientific (TMO)
Acuity Brands (AYI)
Icon Plc (ICLR)
Once a stock trades sideways for some time, it builds momentum as it coils. The moves that result from a breakout tend to be explosive.
While the market has spent the better part of the year moving back and forth, above and below positive for the year, many stocks like these continue to make new highs.
The Dollar is Extended
CNBC and other financial pundits are singing the praises of the continued strength in the Dollar. Its very typical to see the financial media latch onto an idea quite late in a cycle.
Taking a look at the Dollar via the UUP, I don't see a strong risk/reward trade here. All we hear from the media is how Dollars are going higher...hmmm
The
weekly chart going back to mid-2013 shows a clear 5-wave rally, and suggests the move is long in the tooth. The Dollar built a 1-year consolidation area through most of 2014. It has since surged from its September breakout and rallied 25%.
Now the media says "buy any weakness". The time to buy Dollars was back in September as it was emerging from its support base, not 6-months later after a vertical 25% move.
In my opinion, the price action doesn't suggest getting aggressive in the space currently. If you are Long here I think the trend is intact and would still be holding positions, but for new entry I don't like the odds.
The Market Trend is Higher
Regardless of what you "think" about Fed policy, government, expensive valuations, interest rates, global unrest, oil prices, strong Dollar, etc. This market is at all-time highs. The trend remains higher and if you are betting on some outcome other than making money in a raging bull market, then you are out of position and playing low probability trades.
The market doesn't care about your opinions or what you think
should happen. It cares about what it cares about. If you are not aligned with that then its you that has a problem, not the market.
As you can see if you have been sitting in cash or short this market, you have been correct to do so only about 5% of the time and have likely missed one of the best market moves of your lifetime.
Yes eventually this will change and the market will correct substantially, but if you are positioned for this outcome now, you are not listening to the market. All dips continue to be bought aggressively and the market is continuing to make new highs regularly.
You dont have to be a genius or overthink this.
Place stops below the uptrend channel and trail them higher each time a higher low is made. Just imagine how your performance over the last 2 years would have been different had you simply stuck to that strategy.
Investing doesn't have to be complicated. You need to be able to identify the beautiful simplicity of the market, while others around you search for more and more complex formulations. Higher lows/Higher highs. Thats about it. If you stick with that strategy you will be amazing to see the results that can come from it.
A successful strategy is one that keeps you invested in the market as it goes higher and alerts you to adopt a more cautious posture when trend conditions deteriorate. This is what we do here, we look for the best trends and ride them until they end.