Saturday, March 29, 2014

Weekend Update: Mixed Messages

It's been choppy, sloppy and mixed trading for much of 2014 and it doesn't exactly look like that will end any time soon. My radar is reaching level 2 status, but I'm not quite ready to go full bearish just yet. I still think we have another surge in us before we see an intermediate term top in stocks. We are however likely getting very close to a corrective period as many warning signs are surfacing at the moment. This week we are going to take a look at the good and the bad in the market. Depending on how these trends continue over the next month will likely tell us everything we need to know.

(All charts shown are Weekly bars)

(Mixed) The good news is the SP500 is holding its short-term range and we see the 20 WMA @1,825 still below current prices. The SP500 is the strongest, relative, US index currently. What is troubling about that is when large cap stocks begin to lead in a rally, it's usually near the end? Could be trouble...


(Negative) The Russell 2000 small-caps and the Nasdaq both failed their intermediate RS uptrends vs SP500 this week. Both are testing their 20 WMA and seeing distribution signs. These indexes represent higher growth/higher risk companies that tend to show Relative leadership during strong markets.


(Negative) Bonds are breaking out, while skimpy, a breakout's a break out. This is a big level for stocks. A major swing isn't confirmed yet but it's toeing the line. We have been waiting for this Double Bottom to trigger for some time now and this week's close is the highest weekly close in nearly a year.


(Mixed) Our portfolio continues to show increasing allocations toward cash and bonds now, as well as Utilities and Health Care ...which are key defensive groups. Fortunately we are still seeing WFC, PBW, PPG, CMI showing strength and holding up. With this week's add to our TLT position on the breakout signal, we now are holding: 32% Cash, 10% Bonds, and 58% Stocks. So we are still leaning with stocks at this moment, but again our primary holdings are more Defensive in nature and we are not holding our high momentum name DDD as well as our Consumer name F. Those represent the highest upside picks in terms of a strong market and economy. To see those failing while Utilities and Bonds are leading is not a great signal for the market as a whole.


(Positive) Big banks are still performing though. The XLF is in breakout mode. WFC, BRKB, USB, AXP, JPM are at or near their all-time highs. When XLF is a leader the market is usually strong.


(Negative) The Consumer space is undergoing a large shift for the negative:

Consumer Discretionary stocks are weak. To put this chart in perspective, this is THE uptrend vs the SP500 since the 2009 lows. Coming into the year Discretionary was a key sector to watch as it has lead for the ENTIRE uptrend. A breakdown here looks bad.

While we see the more "risk on" Discretionary stocks breaking down from a long-term Relative trend line, we are seeing the Consumer Staple stocks beginning to breakout here after being tattooed for the better part of a year. Typically when Staples lead the market it is not a good sign. These are your true Defensive names: Coca Cola, Procter and Gamble, Phillip Morris, Colgate-Palmolive, etc. Strength in these names means investors are expecting turbulence ahead and are looking for shelter.


(Mixed) Metals are unsure. We've seen a strong rally recently but also a brutal smack down the last two weeks.

Gold has seen a strong rally since the beginning of the year, but the last two week's action has taken back roughly half of those gains. I said last year that I would begin to worry about stocks when Gold (and Bonds) began to build bottoming formations. We have seen this over the past 6 months in both groups. Investors are seeking safety, that should not be overlooked.

Palladium, while seeing some quick profit taking too, has managed to hold its new long-term breakout. Within the Metal's space, Palladium continues to be the leader and Relative to stocks, is looking fantastic as well.


(Positive) Sentiment is souring recently. It seems that most participants feel the market is headed lower from here, yet we are still above support. See the latest AAII Sentiment survey here. Stock Twits Sentiment for the SP500 came in at 40% Bulls and 60% Bears this week as well. We are seeing some new found hate recently which is typically a contrarian indicator.

For those counting along, that's 2 positives, 3 negatives and 3 neutral. When it comes right down to it though markets are still in uptrends and major support levels are still in place. There are some bright spots and some blemishes, we simply need to continue to adjust as the market adjusts. Think of managing your money as a steady, flowing stream. We flow from one area to another, seamlessly and smoothly as the flow carries us. Many invest more like a waterfall. They are all-in, all the time and things start to speed up until they lose all control and fly right off the edge. That is what I try to avoid doing at all cost. If you let the market tell you where and how to position, things will flow much more smoothly and successfully. Follow the strength and manage your risk first. Let's see how this all shakes out from here, either way we will be listening to the market for the best path forward.


Wednesday, March 26, 2014

Its a Chop Fest, Don't Get Hacked to Pieces

 Here is what we have been dealing with for the past month:

SP500 30 minute Bar Chart
That is a whole lot of chop without accomplishing anything. We are perfectly flat over the past 30 days, while the market has swung from highs of 1,884 down to 1,835. These environments used to be the times when I would give back most of my gains from the prior rally. I was over-trading the range and getting caught in all the false breakouts/breakdowns. The most important thing to understand about these swinging ranges is that all the movement between the range highs and lows is noise and is to be ignored as much as possible.

A very simple way to avoid these troublesome periods is to take a longer view of the price action. Here is a weekly view of the same range:

If you zoom out a bit and look at the "forest" instead of obsessing on the "trees", you can see how by stepping back some the picture looks dramatically different. When you look at the market this way you can see how its an actual breakdown of the range that would be trouble, but within that range we are still above ALL major support.

When the market goes into these range consolidations I recommend one of two strategies:

1. Move into a large cash position and wait for a resolution of the range either higher or lower. This protects you from the emotion of watching your accounts bounce around and listening to all the worry in the media about how the market is at a top. When the range decides itself you can then reenter as you wish.

OR

2. Adopt a longer time-frame for your positions and wait for the sideways move to declare itself. 

I prefer to take the longer view and that makes dealing with choppy short-term consolidations VERY simple. If you can sit through some daily turbulence and not freak out, taking the higher time-frame plan causes no harm to your accounts, you incur no unnecessary transaction fees and can patiently wait for the next real move to prove itself.

This is a very important concept to understand and apply to your models. Choppy sideways markets should not wash out your hard earned gains. There are times in the markets where sitting on your hands is the best approach. This means no over-trading during sideways moves and not forcing positions when there isn't any reason to do so. We have had a nice run, if this range resolves to the downside and ends that run, so be it. But I will not just be giving my profits away until we have confirmation of an actual shift from this holding pattern.

A break of the range to the downside would likely trigger many failure signals as the key support at 1,835, the rally uptrend support, and 20 WMA are all tucked in just below these lows. 

Stay cool, don't over-trade, and don't obsess over every wiggle until something real occurs.


Saturday, March 22, 2014

I'm a Bull on America! Are You?

What's crazy to me, is that it is contrarian thinking to be positive on our future as a country. I deal with the general (and not so general) public in my day to day business. I make eyeglasses and am running my parents 32 year old self-employed business. Being that I sell eyeglasses, I get to meet and talk with almost every kind of person alive. No matter your race, age, demographic, political views, religious views, everyone shares in the dubious gift of poor eyesight. While talking with these folks, conversations often slip outside the bounds of the eyecare landscape and we share many things. We talk about my new family (the older gals love the pics of my baby girls), their families, music, movies, and yes often the "future".

A recurring theme that continues to find its way into conversation is some sort of negative event headlined future, generally resulting in our demise. I know, cheery stuff right? Especially when all I am suppose to be doing is helping them see. They tell me about the next imminent environmental calamity, or how the US Federal debt levels are so high that we will soon witness the collapse of the American government and there will be total anarchy. Or they say how my generation will be the weakest economic driver in history due to our current outstanding student loans and our inability to find employment. And I hear all that just in my normal 9-5!

Then we hear and see it in our homes. We see it on the news, in the media and in our regularly scheduled programming. Amazon Instant Video offers an interesting service where they release a series of "pilot" episodes of original series and viewers get to vote for which show they like the best. But I noticed that at one point nearly half of the offered shows involved some form of post-apocalyptic America lifestyle. One was an alien invasion, another was environmental disaster, one was civil war and anarchy. You get the point.

Everywhere I turn these days its going to be the end-of-the-world and there is nothing we can do to stop it. The wheels are already in motion and its going to happen any day now.

Putting the Sci-Fi theater aside, most Americans seem to think the economy is in dire trouble, the government is on the brink of meltdown, and that our current and future generations are pretty much sunk. However I tend to see all of those negatives as some of the strongest potential catalysts for improvement we have EVER seen. I want to highlight 4 key catalysts for America's very bright future ahead:
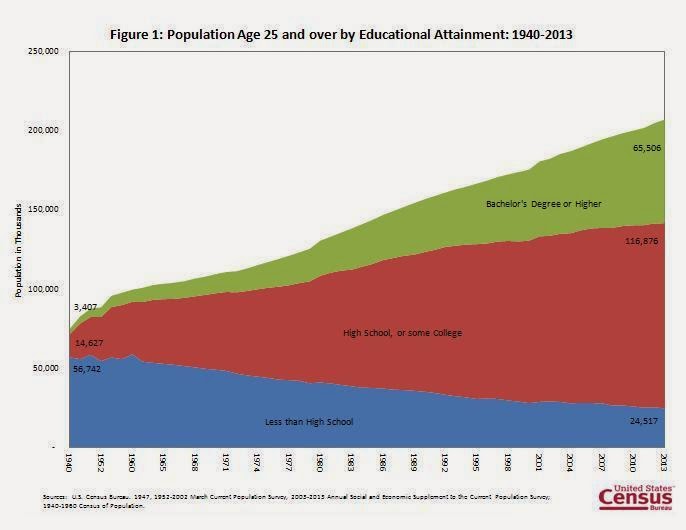
1. Education
Yes we, as a whole, carry large amounts of student debt. Which they say we will never pay off, we won't be able to buy houses either because no bank would loan someone that high risk more money. But consider as a society becomes more educated, it is able to excel and develop new technologies that improve the efficiency of that society. If you look at the historical data of US education rates, especially those earning a Bachelor's Degree or higher, we are at levels never before seen in our history. If logic follows, it would make sense that our brightest years are ahead of us due to the dramatic increase of higher education rates.


Another interesting tidbit for a consumer based economy is this: The average wage for a college graduate is significantly higher than that of a High School diploma earner. If we have the highest college education levels in history, it would follow that we will earn at the highest level in American history. People making more money is good for economic activity.


2. Employment 
Recently we have experienced a relatively high level of unemployment in America. The Great Recession included a spike in unemployment rates not seen since the early 80's. At the height of the recession unemployment levels were at 10% in 2009

   I view our current landscape very much like what we saw in the early 1980's. Unemployment was high due to the largest generation in American history at that time (Baby-Boomers) entering the work force. But over time they found work, started families, bought houses and grew the economy.

Currently we are being held back by the last "hangers-on" of the Boomer generation, who have needed to work extended years to pay for their retirements and health care. In my opinion we have seen the worst of this and over the next 5-10 years these desperate souls will be forced to step aside for their younger, more educated successors (that's us!). This will cause unemployment to continue to decline, will allow for student loans to be paid down and our generation will begin to perpetuate the cycle that our parents did. We should expect at least a similar growth achievement compared to the 1980-2000 advance.

Jobs cure all, especially in a consumer based economy. Once our parents get out of the way and stop blocking our job entries, things should continue to improve dramatically.

3. Housing 
It is my opinion that the rental market is in a bubble. No one is talking about it, but I see it everywhere. The fact that no one is mentioning a potential peak in rent rates and apartment construction makes me believe even more strongly that we are near a turning point.


I would like to highlight a couple key facts as to why now (from 2010-2020) is the time to be a BUYER, not a renter:
1. 30-year fixed mortgage rates are at ALL-TIME historical lows (even with the recent increase over the past year). 4.25% is not a high interest rate. I expect rates to stay low for the foreseeable future, but they won't stay low forever.
2. Rental rates are continuing to rise and are at some of the highest levels they have ever been
3. Many struggling recent college graduates are still waiting to start families and settle into stable careers
-Most are renters and many others are living back at home until they can get on their feet.
-This generation of potential buyers is the largest generation in our history

All of these points highlight one simple thing, Housing has an enormous potential to grow over the next 10 years as jobs open up and more new families begin to seek permanent homes. The nay-sayers point to this delay as a major road block for our continued economic progression. However it is apparent to me that these concerns are playing out currently and only present upside surprises from here. Conditions continue to favor improvement since the worst levels we have seen in our lifetime are now behind us (2008 recession).

4. Energy Independence 
You want a way to pay off the ungodly trillions of dollars in US Debt we currently have? How about through the exporting and lack of importing foreign oil. At the current price of oil, WTI is just under $100/barrel, how many barrels of oil would it take to pay off our debts? The current consumption rate of oil worldwide is roughly 85,000,000 barrels/day, which equals $8.5 Billion a day. If the US controlled the majority of the worlds reserves we would be in a very strong position to not only grow our economy but also get ourselves out of any debt problems really quickly. While some of the data is still speculative, it is widely known that the US has the potential to be far and away the leader in global energy production going forward. New oil discoveries are said to have more oil reserves than the entire middle east.
-The Bakken, the Eagleford, Green River...All of these discoveries could make the US completely energy independent within the next decade.
-The primary concern with US oil extraction is the potential environmental damage and I feel that once some of the more archaic practices see technological improvement, this will be a reduced (not eliminated) impact.

Another very interesting movement in the energy space is the increase in infrastructure dedicated to renewable energy sources, with solar being a leader for growth going forward.

Take a look at this for a positive sloping trend:
The amount of solar energy being produced has never been higher and we have seen a clear shift in the aggressiveness of that movement. We have also seen large steady growth in connection capacity over the past 6 years.

US Grid Connected Photovoltaics Capacity (MWp)
2007 2008 2009 2010 2011 2012
474.8 791.7 1261.6 2165.7 4,010.70 7373.8

Every bit of energy we generate from our own resources is that much less that we have to buy from someone else. The days of seeing energy as a drag in America is ending. We are seeing huge potential opportunities now both in crude oil deposits and in alternative energy infrastructure.

-The possibility of Tesla's "Giga Factory" could begin to revolutionize our energy storing and transporting needs as well.


My discussion today is meant to show the other side of the coin. I absolutely agree that SOMETHING could go wrong and the world may undergo a dramatic shift. But what if it doesn't? You spent your entire life expecting something that never came and now you failed to plan for the alternative. The way I see it, if any one of many major calamities occurs on Earth in our lifetime, we will all be pretty much screwed anyway. You shouldn't stop living because you know one day you will die.

What America is and where it came from, not a single person that had a major hand in the development of America was a pessimist. This thinking that only something bad can happen is a very extreme position to have, it is just surprising to me that so many share the same view.

 I for one will continue to bet against the herd and continue to live happily with my loved ones. Its never a bad idea to prepare for emergency circumstances, but to KNOW an imminent disaster is upon us and live your life around that bubble is crazy to me. I expect things to go pretty much as they always have, forward. We continue to live longer, have lower infant mortality rates, more knowledge, better technology and continued opportunity.

If I was a betting man, my money would be on America.

Friday, March 21, 2014

Base Target Acquired UNH

With this week's mixed trading, a strong standout was UNH as it rallied strongly every day this week and achieved its base formation target price. Due to this acquisition I reduced 1/3 of my holding in UNH and now hold a 2/3 position. We closed this portion of our trade with a very nice and quick 7.28% gain in just 3 weeks.

Lets take a look at this week's action and our target acquisition.

UNH daily view

There you have it. Just a nice quick and easy gain booked. Now we will continue to run our remaining holdings until trailing stops are taken out. So far so good as this should just be the first step with this long- term bull trend.

Saturday, March 15, 2014

Weekend Update: Looking for Higher Highs

The definition of an uptrend bases around higher highs and higher lows. The path of least resistance is to align yourself with the dominant trend. While it is very important to be aware of the higher lows in an uptrend, today I want to discuss the more fun part of the uptrend dynamic, and that's higher highs! Everyone loves higher highs. It means everyone is "in the green" on their trade, there is strong momentum behind the underlying asset, and it means our initial thesis so far is correct.

Most traders understand this concept, yet still most fail to follow along with the persisting trend. Humans like to fight the path of least resistance as it seems to simple and assume that it will soon be coming to an end. Yet Isaac Newton' s First Law of Motion states "An object at rest stays at rest and an object in motion stays in motion with the same speed and in the same direction unless acted upon by an unbalanced force." Inertia is a powerful thing; an object in motion tends to stay in motion. 

That being the case we want to be able to identify what stocks are continuing to confirm the current trend and which are beginning to be effected by an "unbalanced force". How do we do that? Simple, we look for confirmation through higher highs.  

 Let's take a look a how we go about searching for market strength and what higher highs can mean for your bottom line.

Here is the SP500 Weekly chart showing the current uptrend:

 What we want to do now is compare our Watchlist stocks to the SP500's higher high and see which confirmed the rally and which did not.

Laggards- those that failed to take out January Highs

HAIN (2/3)
This is a troubling one for me. While HAIN continues to show solid trending activity and RS, it did not make a higher high along with the market. HAIN is a little different in that it doesn't always trade consistent with the overall market, but you still want to see a strong trending stock make new highs. Nothing is wrong here yet, but I think this bears close watching should we go through a corrective period in stocks. 

F (0/3)
Ford did exactly as you would expect from an under performing stock. While the market rallied to new highs, F merely bounced weakly back into downtrend resistance and is once again looking to roll over. Its too soft for us here, we will need to see the lower lows bottom out and for a higher high to be made before we get back into this one. 

DDD (0/3)
DDD also failed to make a higher high on its last bounce attempt. There is a saying that, "the market will always give you a gracious exit", but you have to take it when it comes. After plunging 50% in a month, DDD snapped back briefly offering a more gracious exit. After a two week bounce, price has resumed the move lower with a second consecutive "gap and go" week. This one needs to be avoided here and simply needs more time.  

Leaders- those trading at a higher confirming high.

-Now we come to the current leaders. This is where we want our accounts focused going forward

CMI (3/3)
While the market did begin to see some profit taking this week, CMI had clearly made a higher high above the prior January levels and is in solid shape going forward. We need to adjust our stop levels for a portion of our position. We have a full 3/3 holding in CMI and while the Cup pattern and RS trend look fine, we can move our 20 WMA stop up to just below that level near $133. $133 is where price consolidated nicely in November and broke out from last month. We still want to use $122 for our Cup pattern stop and also want to follow the RS uptrend for our remaining signal. That's a bit to juggle here, but the position looks solid. 

WFC (2/3)
Wells dipped just off its all-time highs from last week but is looking very strong longer term. In fact it is one of only a few XLF top ten holdings to be at all time highs. Most major banks (AIG, GS, C, BAC) are well off their pre-crisis highs still. It is great to see WFC acting as the leader in the Financial space.   

PBW (3/3)
PBW achieved its short term pattern target early this week and has seen a healthy profit taking since. This is perfectly fine action as we are not trying to jump on every little market wiggle. We just need to be patient with this and let it churn off some of its overbought readings as investors look to position themselves for the next leg higher. A consolidation would allow us to move up our stop to the $6.95 breakout level and expect that to hold on any attempted throw-back trade. 

PPG
PPG has been on fire since its shakeout move 6 weeks ago. Last week was the first down week since mid-January and is nothing to concern yourself with. A small pause here would be welcome and would likely allow us to move our stop to the $191 breakout level. 

UNH
UNH is giving a little throw-back to test its prior breakout, but looks to be in fine shape going forward. The move to new highs the past two weeks showed confirmation that the prior trend is ready to resume. A move below $73 would likely indicate that the consolidation needs more time and we would want to be very cautious at those levels. Up here though, sky's look clear above.  

AEP
AEP put in an awesome week. After a big down Tuesday, it just ripped 3 straight days and looks to have worked through its breakout profit taking. I think higher prices from here are likely. 


--The stocks that make higher highs during rallies are the market leaders and will likely be the ones showing the most out performance on the next move higher. If your stocks make higher highs, then when the market pulls back next, your positions get to work off their over bought levels and can resume the uptrend on the subsequent advance. This is how up trends work; new highs beget more new highs. Here is a great, quick read from Barry Ritholz showing this very fact.  

This is how you identify new/continuing market leaders and this is where you will want to focus your attention and funds. Position yourself toward strength and away from weakness.


Friday, March 14, 2014

Talking Metals

Something that has caught my interest recently is the Metal's space. When it comes to "investment" in metals, be it through stocks or the physical metal itself there are a few things to consider. First you need to know why you are choosing to invest in a certain metal, be it a precious metal (gold, silver,etc) or more an industrial use (copper, aluminum). Are you looking to seek protection in the event of a currency crisis or economic collapse, or are you simply looking for diversification within your regular stock portfolios? This is an important question to know because it will make a difference in how/what you choose to invest in.

Physical Metal
If you are seeking protection against economic instability you will need to focus your attention to obtaining the physical coin/bullion. The theory is that whatever currency was previously in use (dollar bills for example) no longer have value because the backing for that value (US Treasury) has lost credibility.  This is what most people envision when investing in gold; the economy is going to melt down, it's going to be the end of the world as we know it and we will be bartering with gold and silver coins.

While the end of the world scenario is possible, I personally find it unlikely. That being said when you invest in physical precious metals you do so for insurance, "in case". The buying of physical coins should not be done so for trading purposes as commissions (spreads) are high when buying physical coin. Buying metal should be done for insurance against your dominant currency losing value. In the event some panic event does ensue, your silver and gold should have withheld their value if not risen significantly and you will have a way to trade effectively.

You can buy physical coins from a lot of places, just be sure that who you are dealing with has a strong reputation and has been doing business for many years. There is just something uneasy about mailing your money to some internet company and hoping they send you something (let alone genuine) in return. Find a reputable dealer and buy incrementally over time. Even if you only buy $100 at a time, slowly accumulate some shiny metal and pass it along to your kids. Start with silver as it is less expensive than gold; I personally like the .999 oz US Mint Silver Eagles which currently trade around $21/oz. Once you accumulate a good amount of that and you have more money to save you could then start to buy some gold. Gold is more expensive as currently it trades near $1370/oz. but when you can afford some it wouldn't be a terrible addition to your overall investment diversification. Keep it very safe though, I prefer a safety deposit box or personal safe. Safety deposit boxes are the best way to go as then nothing is kept on your person, has additional security and often insurance against loss.

Metal Stocks and ETFs
The other option for investing in metals can be done through stocks and Exchange Traded Funds (ETFs). You can buy mining stocks, specific industrial companies, or ETFs that track the spot price of an individual metal. This is how you want to "trade" metals and diversify risk within your investment accounts. These are all treated exactly like trading stocks, they have a ticker symbol and are easily bought and sold through any broker you may use. Just know that when you buy the GLD (the ETF that tracks spot gold prices) you are buying "paper gold" not physical bullion. If you are a "gold as insurance" investor, then this is not the strategy for you. Just because you own a GLD share does not entitle you to swap that share for physical metal, the GLD fund will tell you that you own paper gold, not actual gold. Your gold is just as good as your US Dollars...paper. And of no help in a real crisis.

But if you are looking to trade metals and just try to catch trends and momentum in supply an demand then stocks and ETFs are the way to go. What we want to do with these is treat them exactly like we would our stocks. We want to buy the out performers and avoid or sell the laggards. So let's take a look at the metals and a few stocks and see how they measure up...

These are the primary futures market metals and their prices can be followed 24 hours a day on Finviz Futures page. Here is a comparison chart showing the past 2-year performance of each of the 5 primary traded metals:

1. Palladium (white)
2. Gold (yellow)
3. Copper (orange)
4. Platinum (blue)
5. Silver (grey)

We like to buy strength and sell weakness. Looking at this list the clear leader over the past two years is Palladium. The most interesting thing to notice is how 4 out of the 5 metals all got crushed in sympathy during 2013, yet Palladium hardly budged and is now the only one making new multi-year highs. Lets take a closer look at Palladium as it is currently showing an incredibly favorable setup and breakout attempt.

PALL (Palladium ETF)
 You can see here that this is just about everything I could ask for when looking for a strong, positive setup. Price is breaking out of a multi-year coiling triangle formation and is attempting to take out early 2013's highs. Relative Strength vs the SP500 is also confirming the breakout, showing strong rotation into the group. Pretty simple here folks. If you are interested in diversifying your portfolio away from stocks and bonds to a more "market neutral" asset class, then metals could be right for you. And if you are buying metals, it certainly appears that Palladium is the metal of strength and risk/reward at the current time. I am long Palladium via PALL in my personal accounts.


Now lets say you would like some of the same commodity exposure but would prefer to do it through a company involved in the mining and manufacturing of a particular metal. In that case you could look to any number of companies that do just that. Here is a quick look at a few of the stocks I follow for that very purpose.

Freeport McMoran FCX (Copper/Gold Mining)
FCX is a large multi-national copper and gold miner. Unfortunately the combined overall weakness in Gold and Copper over the past few years has not been kind to the profits of Freeport and the stock is mostly directionless to down over the past two years. Relative Strength has not been in favor of higher prices here for much of this time either. There have been a couple trade able opportunities, but nothing major yet.

Here in lies the problem with mining stocks: they are tied to the performance of the metal itself AND they still offer headline risk outside of commodity related effects. They are still subject to quarterly profit targets and costs associated with running a business. So just because Gold is up on the day FCX could be trading lower due to any number of outside business/sector related factors.    

McEwin Mining MUX (Junior Gold/Silver Mining)
Here is a stock that I have followed from the beginning of my trading in the markets. This has been the stock that has caused me to lose more money than almost all my other trades combined; I have learned many lessons trading this stock unsuccessfully and it still finds a way to coerce me back into it. That being said, I am a much better trader for it due to my understanding of risk management and how following a story and ignoring price can get you into a whole lot of trouble. On top of that, the idea of trading with the trend has been fully reinforced after losing money trying to trade Long a down trending stock.

Lets take a look at the larger picture here to see what I mean:
It took me much longer than it should have to understand that it is best to trade with the primary trend. I basically got smoked for all of 2011 and finally threw in the towel after about the 6th forced entry into MUX right in the beginning of 2012. However I have been recently drawn back into the name as over the past few months prices have seemed to stop going lower (no more lower lows) and have begun to reverse (breaking above prior lower highs). Like I said above, I have learned an awful lot over the past few years and have finally put a winning trading system into practice. What's interesting is that this past few week's entry signal is the 1st "actual" confirmed signal from my system parameters and every other entry I made previously was against those same parameters. When you have a plan and stick to it, it works. When you don't have a plan and just try to make trades, it doesn't. This shows first hand how that can play out and having been involved in the entire process with MUX, I fully understand now what it takes to identify winning stocks (entry points) and how to avoid the more challenging setups out there.

Nucor Corp NUE (Steel/Iron Mining)
NUE has been in a solid uptrend over the past few years but as with all the mining stocks, is well off its all-time highs. The current Relative Strength has been lousy, but as mining stocks go, the current uptrend in price is better than most. Still I would like to see more from a Relative perspective before getting too aggressive here.

Alcoa AA (Aluminum Mining)
AA has been a joke of a stock since the 2008 market crash. However over the past 2 years it seems to have found a bottom and has recently gone nuts ripping nearly 80% off the lows back in October of last year. While this seems like it has gone too far too fast, take a look at the longer term view to get an idea of where we are by comparison:

As you can see, putting the recent surge in historical context shows that plenty of upside is possible in the future should things continue to move in a positive direction for Alcoa.

Most mining stocks have been obliterated since the market meltdown 6 years ago, and have traded lower with the weakness in the coinciding metals they mine and manufacture. Since the beginning of the year so far we have seen metals and mining stocks begin to show some life for the first time in a long time. It would behoove you to begin to poke around in this space as the upside could be fantastic.

Currently I am Long Palladium straight up via the ETF PALL and am Long MUX. But one could make the case that many of these groups and miners look very interesting from a long term valuation standpoint at these reduced levels. Its always a good idea to notice where there is a lot of investor hatred and scorn, especially when those areas begin to show signs of bottoming and beginning a new trend higher. That unwind of negative sentiment can be a very powerful thing and right now the metal and mining space in the market looks both hated and bottoming. I have begun to position toward this area recently and should it continue to show Relative Strength, I will continue to increase my exposure to those best positioned for a recovery rally.
However you choose to invest in metals, I think due to many factors, the current setups look favorable across many names and asset classes.

Sunday, March 9, 2014

Weekend Update: Rally Road Map

US markets continued to rally this week and are once again at new all-time highs. While most major sectors traded in lock-step with the SP500, we did see some interesting rotation going on under the surface, most notably money flowing into Financials and out of  Biotech and Utilities.

There was also the February Jobs Report that was released Friday morning showing better than expected employment figures than analysts had expected. It still seems like markets want to trade higher over the long term, yet it is likely that we will see some sort of meaningful correction before another big leg higher. We have briefly touched on the Elliot Wave Theory of market trends before and I think it would be a good time to revisit where we likely are in the current bull market.

In Wave Theory it is stated that markets trend in 5-wave cycles. These cycles can be observed on any time frame you choose to view the market, but for our purposes we will looking at the overall secular bull market starting from the '09 lows. (Watch a quick Elliott Wave tutorial here)

From my perspective we are somewhere within the 3rd wave of the long term 5-wave sequence. 3rd Waves tend to be the longest of the 5-wave count and really fuel the sentiment that leads to a 4th Wave correction and then the 5th Wave blow-off surge. The problem with Elliot Wave theory is that there is ultimately no way to know exactly where you are in a cycle, you just have to discern as well as you can and look for clues that would suggest the approximate location. Here is my best shot at the current count:

SP500 rally from post-crisis lows roadmap

SP500 Wave 2 Correction
The Wave 2 correction targeted the 38.2% Fibonacci retracement before resuming as Wave 3. The 38% retracement is a primary level of support after a rally, although it is not uncommon to see a 50% and even 61% corrections also. In powerful trending markets 38% is a go-to level of support.

SP500 Wave 4 Simulation
You always want to be looking for patterns in the market. So if we use the Wave 2 correction as our initial guide we would expect to see the 38.2% Fibonacci retracement of the 3rd Wave. The most significant levels to watch are where prices supports cluster together; the more support levels coincide with a particular price, the more important the level. When looking at the "potential" Wave 4 correction I notice the 38% Fibo is at 1,570, I notice the prior all-time highs from '07 were at ~1,570, and the uptrend line from the post-crisis bull market rally also intersect near the 1,570 level. On top of that, markets love to retest prior breakout levels and it would seem reasonable to retest the '07 highs as a correction target.


If my analysis is close, we are still well within the 3rd Wave rally. There is no way to anticipate the end of this wave and it can continue much longer than is rational. We will simply have to follow as best we can as long as the market can hold its trend of higher highs and higher lows. Once that uptrend is broken we will most likely have to step aside and let the 4th Wave correction play out. Using a basic Fibonacci retracemeant measure, I would expect the 4th Wave to target the prior breakout and retest that level as support. It is from that level that I believe the 5th Wave would launch from. We will continue to monitor this in real time and make adjustments as they come. It will be assumed 1,570 will be MAJOR support on any sort of broad market weakness.  For now let's continue to defer to the trend and follow our outperforming holdings.


--This week we only had one change to our holdings and that was getting the final exit signal on DDD. We also saw several new highs and some very strong moves. Lets take a look:

DDD (reduce 1/3 position, 0/3)
First things first, here is the look at DDD and why we got our final exit signal on our remaining 1/3 holding. While the initial breakdown last month looked nasty, the Relative uptrend managed to hold its trend support, the rollover this week could not hold that trend and has now failed. Price is below the 20 WMA, 1-year RS trend has failed. and the look of a bearish Head/Shoulder Top formation was triggered with this week's weak finish on Friday. It's time to watch this one from the sidelines and see if it can reverse this negative course.

PBW
PBW really moved this week, advancing $.54 or nearly 8%. Since the breakout Clean Energy has jumped over 15% in two weeks. That is exactly the kind of move we hoped to see with these strong base patterns triggering. We are watching two patterns here and the smaller pattern has acquired its measured target at $8. Now I would expect some mild consolidation before the next move to our upper target near $10.40. This is a group of strength going forward.

WFC
WFC, along with the rest of the Financials really saw a big pop this week. This would be very positive for the market if the dormant Financial group could rotate back into the market leadership role. This will be definitely worth watching closely now.

HAIN
Speaking of strong weeks, HAIN really caught a bid this week rallying 5.5%. So far this just continues to chug along the uptrend support and consistently forms higher highs and higher lows. We still want to be riding this one.

PPG
PPG had a solid week and continues to outperform vs the market. Just a strong uptrend here, nothing to over-think, simply continue to enjoy the ride.

UNH
UNH stalled a bit this week after a very strong 4 week rally which is expected. This one is just getting started and a little cool off short term could be good for the longer term rally.

CMI
I will say the same thing for CMI. It just will likely need some time to digest the recent bounce before continuing higher.

AEP
You can see how these markets rotate in the short term. Only two weeks ago CMI and AEP were our two strongest performers based on their recent price action. Yet the last two weeks has seen a little cooling and we have seen some of the weaker names heat right back up with HAIN and WFC. There is nothing to worry about here either as I think this continues higher after a pause.

TLT
Treasury Bonds came close to triggering an exit for us this week after once again being rejected hard from the $109-110 resistance. We will need to see a clean break and close below the 20 WMA and a failure of the RS trend support to stop us out. So far it seems that stocks have the advantage over bonds here as bonds continue to struggle to take out major resistance and stocks are at new highs.


Overall it was a strong week for the markets and for our Portfolio, I think short-term the market could need a rest but as long we it continues to trade above intermediate term trend support we have to continue to defer to the strong price action. Once the market begins its potential Wave 4 correction we will likely have to step aside and reassess our outlook and holdings until the long term trend can resume. Its never a bad time to prepare for what could be around the next corner. That doesn't mean we try to anticipate what might come, but it does mean that we have a plan in place for that inevitable shift in trend.

Wednesday, March 5, 2014

Are You Buying Pullbacks or Trying to Pick Bottoms?

An ongoing discussion in studying the markets is when/how one should go about buying a stock. Some like to "buy pullbacks", some like to "buy breakouts", these two are thought to be completely different entry strategies and yet I could argue that you can employ both strategies simultaneously without violating either of the underlying meanings between the two. How, you ask, can you buy both a pullback and a breakout? That doesn't make any sense you might say. Well the answer lies in your understanding of the larger context of the asset in question.

Most traders take such a short-term view of the market and their positions that they cannot understand blending these two concepts into an actionable and successful entry strategy. Take CAT as a perfect example of this (I had this same conversation with a friend of mine recently).

Here is the Daily chart of the last 6 months for CAT:

You can see on the 6-month Daily chart I entered CAT after a strong surge in prices that took out the prior highs and appears to be a "breakout buy" (which it is, especially in this context).


The pullback buyers would argue I could have just waited until later the next week to get a better entry or I could have really made out huge if I had bought the big drop 3-weeks later in late January. While it is true that I could have made more had I bought the day before CAT released their Q4 earnings report (Jan 27th), I would be hard pressed to find someone with strong risk management principles that would be willing to buy that huge flop heading into a highly volatile earnings report. In hindsight it would have worked perfectly, but hindsight is ALWAYS perfect.

The discussion I had with my friend was that he wanted to buy into CAT and liked the breakout, but it seemed like it had moved "too far" to buy where I did. He likes to buy pullbacks, yet the "pullback" if that's what you want to call that pre-earnings plunge was too risky for him to buy also. He uses strong risk management practices with his positions so this one just didn't fit his setup. And that's fine, you can't buy them all. But he really liked CAT and wanted to buy it, he just simply couldn't find the "pullback" he wanted. Since that conversation CAT has gone on to rally strongly and is positioned for more upside in my opinion, but that's beside the point.

The point is that if he had zoomed out the view and taken in the context of the bigger picture, my "breakout entry" looks a lot different. Here is the wider, Weekly view:


While it is true that I didn't "pick the bottom tick" here in CAT, my entry point looks a lot like a "pullback" buy considering where the prior highs have been over the past 2 years.

What I'm trying to get across is that those who seek to squeeze every dollar or tick out of the market are going to be very frustrated and stressed and will likely miss out on many strong opportunities. There is a common maxim on Wall Street that the best moves never give you a comfortable entry point. This is exactly why I prefer the clarity of new multi-week highs to enter a position rather than hoping I can save a buck a share and get an even better entry.

 If you simply take a longer view at things you can find appealing values that have corrected from the highs and have actually put in a bottom in price and begun to reverse higher. By not being overly greedy and trying to anticipate every low in the market, you can identify circumstances where risk/reward favors a particular low risk entry.

This "buy the dip" mentality that many Wall Streeters share generally requires much emotional discretion when buying a stock. I hear it time and time again in the financial media; the analysts beg for a pullback to put money to work, then when the pullback comes they don't pull the trigger because they think the pullback will go further than this and they can get an even better buy. The problem is that pullbacks never come on comfortable news and nobody rings a bell to indicate that the pullback is over. This behavior continues to perpetuate itself as the market recovers before the pullback should have ended and then the same analysts are sitting on the sidelines waiting for the next pullback. The important distinction I want to make here is that those types of traders are destined to fail as they are constantly looking to "pick the bottom tick". It's not news that no one can do this with any sort of regularity. Even the "best" market timer, many consider this to be Tom DeMark, has been calling a Top for this market since last summer. Guess what, he has been continuously wrong. Even someone who is considered the best at picking turns in the market can't do it with any consistency, what makes you think you can?

If you take a step back and try to identify places where prices have stopped declining and are starting to reverse higher, that is where you can make strong entries. They won't get you the seat on CNBC talking about your "bottom call", but it will make you money in any market while taking less risk to your mental and monetary capital. You will never see me exit a full position at "the Top" and you will never see me enter a position at "the Bottom". Trying to time those events causes much more harm than good to your investment accounts. Its better to find a successful, consistent entry plan and just take what the market gives you. If you try to take every tick out of the market, you will lose.

Here are a few other "pullback breakout" buys I have made recently to show how this works:

EOG

 DDD summer 2013

AMGN


These are just meant to be examples to how you buy after a pullback while price is breaking out to resume the uptrend. I am not trying to show how good I am or anything, because I'm not. I am simply a student of the markets and try to take what the market gives me. I don't want to be a hero and pick bottoms or call tops, I just want to trade stocks where I have a long term advantage from a risk/reward standpoint. Through much trial and error I have found that waiting for a stock to setup and reverse after a pullback/correction seems to be a winning strategy over simply lunging at a declining stock near a prior support area.

Buy the breakout after the pullback and the money will flow. Your account balance will thank you.


While it is true that Entry signals get all the glam and attention, the real challenge is when to Exit a position, as that truly is the dominant factor that determines whether you made money or not. As this is the case I will discuss the subject of Exits in a followup post in the near future. Good trading!