Saturday, August 30, 2014

Relative Strength Works

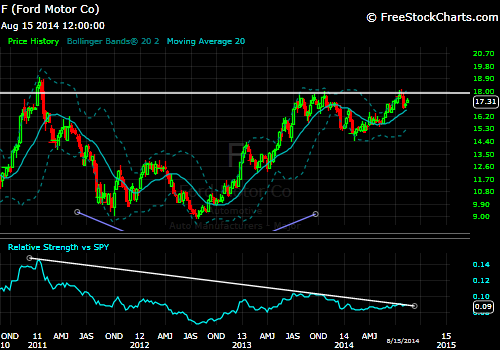
HOW WE USE RELATIVE STRENGTH

If you recall we had a few stops triggered during the last pullback. We lost PPG, CMI, and newly entered HON. But since that time the markets have bounced right back and through the prior highs. Within the bounce we have received new entry signals in BRK.B, ECL, and HAIN. If you are counting at home that's 3 gone and 3 added for a net neutral position change. But if we take a look at the 3 exits and 3 entries you will notice something interesting. Let's see if you can spot the key difference...

EXITS TRIGGERED

-PPG 

-CMI

-HON

ENTRIES SIGNALED 

+BRK.B

+ECL

+HAIN

Can you tell what's different between the two groups? It looks to me like the 3 we sold, while participating in the bounce back as well, not a single one has made a new high along with the market. If you look at our 3 new buys it's clear that each has been breaking out to new all-time highs. 

This is what happens with Relative Strength investing. During pullbacks/corrections some positions fail to sustain their strength, while others step into a leadership role. What we attempt to do is position our funds toward the best and away from the weakest. While this does encourage a little extra movement within our accounts and therefore higher trading costs, it assures us that we will protect against the downside by eliminating our most vulnerable holdings, but then also participate in the upside with our remaining strong holdings and new entries into the best performing stocks in the market. 

In case you were feeling remorse for selling your previous positions, you can see that we more than made up for the exits by repositioning as the market suggested into even better opportunities. This is what we do here. We ride winners until they fail and we constantly look for ways to improve our current positioning. That requires we sell the weaker names and target the strongest available. 


THIS MARKET IS SET UP TO CONTINUE HIGHER

It's not a stock market, it's a market of stocks. People often forget that the market indexes are just collections of individual stocks that will behave largely as a group. If the underlying stocks within the market are showing strength or weakness you can expect the market as a whole to follow the direction of those individual stocks. 

When we look at general market health we look at a metric called breadth. We want to see how the stocks under the surface are behaving and whether they support a continued move higher or if a reversal is building within the individual stocks. Breadth can be quantified in many different ways, one of my favorite ways to discern breadth health is simply to observe the positioning of important stocks in individual sectors. I want to see if individual stocks are set up to rally or are breaking support and moving to lower lows. 

What I am finding are stocks across all time frames and many different groups strongly positioned for increased upside. 

-VZ and IP 30 min bars continued from last week's chart

Stocks in the shorter-term seem to have new positive momentum after breaking bullishly out of support bases. Both VZ and IP were on our close watch-list this week and they were able to break to the upside.

-XLY and XLF NEW HIGH WEEKLY BREAKOUTS


Both Discretionary and Financials continue to breakout to higher highs. I have previously discussed the importance of these two sectors for a continued market rally. So far, so good.

-LONG TERM BASES IN MOTION...INTC, X, NEM, YHOO, TWTR 

INTC Monthly chart with 10 year base breakout in motion. 

US Steel (X) Weekly chart, breaking out from a nearly 4-year base formation. 

Yahoo Monthly chart showing long-term cup/handle base potential...

And YHOO on a 1-year, Daily view showing another base formation in motion currently
This is one of my favorite setups in the market right now as it offers opportunity on multiple timeframes. The shorter term base seems to be leading the longer term setup and could be the catalyst for a breakout. 


Newmont Mining (NEM) Daily chart of the leading gold miner breaking out from an 18-month base structure.

Twitter Daily chart showing reversal signals following its post IPO selloff. 

With the exception of TWTR (newly public company), these bases are not short term wiggles, these are long-term trend reversal formations. And while shorter term in duration, the implication of the Twitter base looks quite similar to how Facebook looked after it's infamous IPO period. 

--I feel that with multiple time frames appearing bullish, you have to be positive on the market as a whole here. Things can always change, but as of now we want to be aggressively long this market and can be doing so on any prefered duration depending on your investing preference. There are very long-term setups triggering, intermediate trends are firing on all cylinders, and even recent short-term pullbacks are finding support and reversing above key levels.

I am currently Long all of the above base setups for private accounts. 


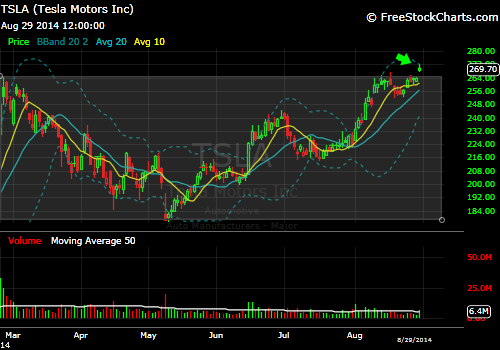
Chart of the Week- TESLA (TSLA)

Q4 2013 Daily view
At the beginning of 2014 TSLA began a breakout move that led to a price gap to all-time highs. The subsequent price action went as follows:

Price rallied to a new high of $270, another 37% above the entry price.

Take a look where prices currently sit:

Q2-Q3 2014 Daily view

Where have we seen this action before? How about just before the last +30% rally. This has a very similar appearance to what we saw one year ago. Even volume confirms a similar pattern. The bears are awful loud and obnoxious about this one, but they are standing in front of a freight train. Anyone still Short TSLA shares as of Friday's close is simply not practicing any sort of risk management. This has higher prices written all over it. Initial targets are in the mid to lower $300's and stops can be placed just below the breakout swing low at $248.

I have been Long TSLA for private accounts since early June and have been adding to my holdings as this move has progressed. I still think there is plenty of upside left in this one.

Saturday, August 23, 2014

Organic Food, All Time Highs and A Multi-Timeframe View

The SP500 has once again set a new all-time closing high. But wasn't the top in just a few weeks ago? When the sky was falling and everyone was running for cover? Apparently not. The market likes to throw curve balls every once in a while to keep everyone honest and on their toes. This is certainly becoming a market where some things really work and others really don't. We as market participants simply need to do our best to align ourselves with the dominant forces, sometimes we get bucked off, but we get right back on.


The SP500 seems to be simply moving well within its uptrend channel. Since this is such a clean channel, what would get me on my guard would be a dramatic move either through the upper channel resistance or below the trend support. Either of those events would show an imbalance shift of sentiment and emotions. But short of that happening, its business as usual in the uptrend channel. I'm not overthinking things here, I'm taking bullish trade opportunities as long as this trend is intact.

With the new high this week comes a new swing low to anchor against. We now have a confirmed support low from the 1,904 prior breakout level. The uptrend has a new "higher low". We like those. I believe the trend is intact above that 1,904 low.

Entering Hain Celestial (HAIN)


There was a big breakout for shares of HAIN this week. If you recall from our time together, HAIN is a long-time member of our favorite stocks list. As a matter of fact we have not be involved in HAIN for just over 20 weeks now, it seems like forever I know. Well this week's reaction to a strong earnings report put an end to that streak. 

Price was able to breakout and hold to set new 100 day highs; HAIN took out the prior lower highs on big volume and was confirmed by Relative Strength showing good money rotation. 

A longer look back shows a very interesting pattern for HAIN:
Looking back at the last 10 years there were many dips and rallies, but something really stands out when you take a look at the trend momentum pattern. Using MACD to gage underlying trend support you can see the times when HAIN was in bull mode (MACD above Zero line) and when it slipped below Zero and lead to a large decline. 

Every pullback but one showed the exact same pattern before leading to a strong rally. As the stock was pulling back, the MACD would test the Zero line, turn higher and cross above its signal line. Each time that occurred it lead to a rally in prices. Only one time it failed to hold above Zero and it went on to lose more than 60% of its value. Take a look at where we are currently!

I appears to me that to ignore this pattern would be crazy and the potential risk/reward here could be fantastic. 7 out of 7 times that the MACD crossed above Zero after a pullback, the stock rallied significantly. Nah Say at your own risk. 

We want to own this stock above the $84.70 support level that contained the year long correction. This is a fairly wide stop, but I think its better to give it some room considering the potential long term implications of the chart above. 

Using Multi-Timeframe Analysis at Key Turning Points

I want to share how I use multi-timeframe analysis to observe the likely outcome at an important juncture. When your stop level is being tested, I feel, is one of the most negative emotional times for a trader. I know I feel as down as possible on a stock right as it sits on support. I'm not sure why this is. My best guess is that when you see your stock is down to its last line of defense, you begin to anticipate its inevitable stop out. The potential pain you will suffer taking that loss weighs on your emotions and it can make trading more confusing. 

What I do to to make sure I have the clearest picture possible is I make sure all timeframes are or are not in agreement with each other. Take a current holding for the Portfolio, IP for example. 

 Looking at the Weekly bars you can see that IP has not quite taken out our initial stop level yet. It is however trading below the 20 WMA for two consecutive lower closes. That coupled with the new low in the RS trend, it appears the range breakout has failed. 

There is justification to sell this position today based on the weekly view point. But I wanted to dig a little deeper so I zoomed in on the action at the 20 WMA.

 While price appears to be failing on the weekly chart, a look at the 30 minute bars gives a better perspective of what is taking place at key support. This weakening action has led to a tight coiling of price in a diamond formation. Typically Diamond patterns are continuation patterns, so this does have a higher than likely outcome of breaking lower from here. But they are mainly seen as "indecision" formations. 

I feel that since current prices are still above my initial stop levels and this short-term price action is still very undecided, it would be better to continue to hold the position further and wait for a breakdown of this pattern below the $47 lows. A daily close below $47 and I will step aside. 

See VZ for another perfect example of this:

VZ Weekly bars
VZ holding the key $48.50 support level, but trading the last 3 weeks below the 20 WMA...

VZ 30 min bars
Price has found a near perfect supply/demand balance over the past two weeks. While the market has been making new highs VZ has been holding and basing. The way I am treating this currently is, I am in and would consider adding more above the range highs at $49.15. OR it closes below the support lows at $48.50 and I am out.

 At this point with the damage done to the Weekly chart, one daily close below this level would see me exit. 

Using the shorter timeframes to assess how price is handling key levels can be very helpful for clearing up any conflicting signals on the longer term charts. I like to use these shorter timeframes after stocks pullback as often there are strong tradable opportunities that appear early as the downtrend ends.

 Breakouts higher from either of these bases above would likely present solid trading opportunities for more tactical strategies. These are short-term moves though so don't mistake a quick trade for a long-term holding.

Saturday, August 16, 2014

Open Position Review

A Quick Word Concerning the Market


There will no doubt be a lot of chatter over the weekend about what Friday's market action will mean for the near term outlook of the stock market. 
-Russian tensions are once again derailing the market
-The Fed is going to be rushed to raise interest rates due to raised economic forecasts 
-The SP500 failed to retake the 50 DMA after todays test
-Whatever else can be seen as a negative heading into a new week...

BUT

One look at what is actually happening in the short term price action of the SP500 shows a very bullish posture. 

30 minute bars

There is quite a bit going on here so let me just explain:

1. The pullback in late July completed a 5-wave pattern (orange trend lines) to the downside that completed as prices retested both the 1,900 breakout level AND 20 WMA. 

2. At the low-peaks of both waves 3 and 5 (white trend lines) you can see that the MACD momentum was making higher lows on August 8th while price was making the 5th wave lower low. This is a positive divergence. Also of note, the MACD held above the zero line on both higher low pullbacks suggesting strong underlying support.

3. As price consolidated it formed a near perfect Inverse Head/Shoulder pattern which triggered on Wednesday and saw strong follow-through on Thursday. This confirmed the higher low from August 12th.

4. Friday morning prices advanced but then were sold back into the breakout level (important retest) on some more Russian headlines. This action proved that 1,944 is important support and it was a strong enough move down to shake out the frothy short-term traders who jumped on for an easy ride. 

5. We then saw the lows for Friday set at the 1,944 support and price soon rallied 11 points to close well above the breakout level. 

This is about as much bullish activity as one can hope for. From my view it appears likely that prices will move higher in the short-term and regain the lost ground from the prior highs. The red line is where resistance should come into play as that is a gap area on the chart which started the two-week pullback late last month.

If the 1,944 support does not hold, that along with the subsequent bullish pattern failure, I would become much more cautious going forward.   

Open Position Review

Entering EcoLab (ECL)

A breakout to all-time highs while the general market holds support... This is what we look for as relative strength investors. We have a very clear weekly signal here with the break above the nearly 1-yr consolidation. The risk/reward is stellar as well. With the last 10 weekly closes above the $107.50 support and the rising 20 WMA there as well, we would not want to be holders below that uptrend support. 

This seems like a steady trend resumption and with our initial stop only 5% below the entry, this sets up as a trade with significant potential. My position size is set at .5R. 

TLT
Bonds blew through a very strong resistance level this week and now seem poised to retest the prior swing high from early 2013. You can see that price has been able to clear the 61.8% Fibonacci Retracement level which suggests that the prior swing high will be challenged. 

TLT sets up for a short term momentum strategy that I call "Re-Capture". Once a pullback occurs from a significant swing point (peak in summer of 2013), price will bounce back to certain retracement levels of that prior pullback. A pattern that I have noticed is that once the final level is broken, the 61.8% retracement, price is pulled like a magnet to that prior swing point. This setup is very simple and is based on the short-term momentum in a stock. Once that last line of resistance is cleared, price tends (~65% of the time) to "recapture" the prior swing high. How I execute this strategy is to keep my risk vs reward as balanced as possible. Once the 61.8 level is broken, you enter the trade and place stops just below the 50% retracement level. I like to see that area coincide with the rising 20 WMA as well to support the uptrend further. Basically what it amounts to is a situation where you have a roughly 60% chance of success and then at least a 2-1 risk/reward on your entry. If you keep doing that over and over through time you will come out well ahead. Imagine flipping a coin and each time it comes up heads you win $2 and each time it comes up tails you lose $1. Well at a 50% success rate, that 2-1 payoff can really add up. 

This is what I'm seeing in TLT right now. This week has triggered a Re-Capture trade. Because of the strength of this week's move the risk/reward is not quite as favorable as I would like at current prices to initiate this trade. But if you were to have a pullback into the $116 breakout area the risk/reward would come back in your favor and it would be well worth an additional entry point.

Through my data on Re-Capture scenarios I do notice that the stocks that make the strongest moves through the 61.8 level (those that make the risk/reward for entry not as favorable) tend to have a very high success rate. But I still like to see that R/R closer to 2-1, and on a pullback that will be easier to achieve.

TWX
Time Warner had a solid bounce back week and now is in the process of "gap-fill" mode. You can't see it on the weekly chart above but the daily chart shows the huge gap lower price made last week. Markets tend to like to fill gaps in price and if this is the case we should see that $85 challenged soon. There is nothing to overthink here, price broke out of a long-term base formation, pulled back to retest the level, and is now bouncing higher. That is just typical uptrend breakout behavior. Stops should be just below the breakout area at $70.50.

SBUX
Despite all the motion in the major market averages, SBUX has maintained a very steady consolidation of the recent upward move. Price is orderly retesting the breakout area near $77 and seems likely to push higher should the market find its footing. Stops are just below the 20 WMA at $74.30

IP
IP has been challenged recently and is battling with its stop level and 20 WMA. There is still some room below prices but its going to need to get moving soon if it is to remain in our portfolio. So far the action suggests more consolidation ahead rather than a strong breakout move. A close below $46.30 will end this trade for us.  

VZ
VZ is in a similar position as IP. This just goes to show that no matter how much personal conviction you may have about a position, the market will ultimately do what it wants. When VZ was ripping higher 3 weeks ago I was feeling pretty darn good about the position. Since then however price has suffered a hideous reversal and is flirting with our stop level for two consecutive weeks. So far $48.50 has held and is seeing buy support. But it better get a turn and get on it very soon or we will be saying bye bye. 

WFC
WFC found trend support this week and put together a little bounce. $50-49 is still a strong support area, so as long as that is intact the uptrend is on firm footing. Below $49 things get dicey. 

BRKB
Berkshire looks fantastic showing strong follow through to another all-time high this week. Relative Strength has surpassed the final downtrend resistance and this seems poised to move higher. Stops can now be trailed higher to the $125.80 consolidation lows. I love a breakout to all-time highs when the market is bouncing from trend support. BRKB is a relative strength winner and this week's action puts that on full display. 

UNH
Much like WFC, UNH has found trend support and saw a nice bounce back this week. We want to be long and strong above this uptrend line and prior lows near $79. 

FCX
FCX is doing its best to test our patience, but it has the look of just a standard throwback type move. There is no harm to the uptrend here as we still have higher highs and higher lows and price is above the 20 WMA. A close below $35 will be enough for me to think this is more than a retest scenario and I would reevaluate my position at that time. Above $35 though and I still think FCX has solid potential.   

ENB
ENB just keeps doing what it needs to by holding all key levels at each juncture. This week price bounced off the cup/handle retest area and I think this is headed much higher. The measured move target for this base formation is near $57. I would want to ride full positions right here and we would reevaluate the holding once that initial level is acquired. Stops should still be placed below the handle swing low at $46.80. 

GILD
Along with BRKB, GILD appears to be our strongest current holding. Since breaking out 7 weeks ago price has motored higher, continually making new all-time highs. With this week's surge we can move our stops to the breakout level at $84. This trade essentially has zero risk for us now as our stop level is right near our entry point. That's not a bad situation to be in; a monster stock making new highs each week with relatively zero risk of loss. You would be hard pressed to find a better investing scenario in the market today.  

F
Ford is this close to triggering a series of massive base formations. A strong weekly close above $18 coinciding with a break of the long-term RS downtrend would be a very positive signal for us. I will be taking that opportunity to add aggressively to current positions. 

Ford is also a key member of the Consumer Discretionary sector which I tend to favor right now and a breakout here could be very good for the group as a whole. 


---Speaking of Discretionary stocks breaking to new highs, take a look at HD right here:
Home Depot is just poking its head above its prior all-time highs resistance zone. There is a lot to like here should this breakout see some follow-through to the upside. They announce earnings on Wednesday, so next week could be the catalyst HD needs to break through this key level. 

I love this setup but also find myself with 3 XLY stocks already in the portfolio and I do have a rule that I don't want to own more than 3-4 stocks in any one group for diversification reasons. I will have to evaluate HD once this level is cleared to see how it may fit into our plans here going forward. 

Again I will reiterate how much I like this sector at current levels. We currently hold positions in TWX, F, and SBUX. But it is noteworthy that HD is attempting this massive base breakout, DIS is continuously making new all-time highs, FOXA is challenging highs, as is PCLN. So there is a lot to like about the setups in the Discretionary space. Its definitely something to be keeping an eye on going forward. 

Sunday, August 10, 2014

Revisiting Key Levels

Key Level Check

Last week markets saw a pretty substantial shake to the downside. This week stocks tried to bounce from short-term oversold conditions. The lower timeframes did see the minor swing high taken out at 1930, but we will need to see the major swing high at 1940 broken before a meaningful bounceback can occur.

During pullbacks/corrections it is very important to not fall into the emotional trap of negative news flow and fear. How do we avoid such reactions? We bring out our levels again and see just how much damage is done to the uptrend and where we will be proven wrong. We did a similar thing about 6 weeks ago and it helped ease some anxiety. So while geopolitical news is swirling, along with an African outbreak of Ebola, lets just examine the US stock market to see if the world really is ending.

SP500 Daily

As you can see we have a well defined uptrend channel and while this has been a decent pullback, the trading action is still that of an uptrending environment longer term. All that is currently occurring is that price is moving from the upper range to the lower, still making higher highs, still making higher lows, and price is retesting the breakout level at 1,900. We discussed previously how prices above 1,900 put this market squarely into breakout territory.

There is absolutely no reason to panic here and your longer-term winning positions should still be mostly held. Until we see otherwise we need to assume that the trend will persist and that buyers will come in to defend the lower trend support. Support is support until broken. The key level for the uptrend is the 1,870 swing low which also coincides roughly with the lower uptrend support. Thats a big level folks, if that breaks we will need to reevaluate our intermediate term bullish thesis.

SP500 Weekly

Taking a longer term look we still have not even come close to retesting the decade long breakout that occurred in 2013. That support should come in around 1,600 and would likely present a fantastic buying opportunity. That would really be a healthy thing for this market; to correct back to that breakout area would certainly get the "crash" folks out in force (as it remains roughly 300 points lower). You need fear to keep a bull market going and a move like that would invoke some serious fear. Fortunately for us we will have been in a cash position for some time and wouldn't really feel much pain from a move like that.

If we breakdown from current levels this is where we will experience the most pain. Being that we are currently 60% exposed to the market here, I believe most if not all of our current holdings would be stopped out on a break of the 1,870 area. A further correction from there down to 1,600 would be relatively painless and would put us in a position to capitalize significantly once the market turns back to the upside.

Thats how I see things here. Really not too complicated. Either we stay in the trend channel and we look for bullish trade opportunities (like we have for the past few years now), or we break from here, take some profits and await the next setup that would emerge.

Round Trip For TWX

That was quite a whiplash for TWX shares over the past month. Fortunately we are diligent at position management and were able to take advantage of this situation. We entered TWX for our portfolio on July 11 and within 3 days price rocketed 20% on a buyout offer from 21st Century Fox. I discussed how our risk had been dramatically increased due to the instant jump and that we needed to use that opportunity to rebalance the position.

When Time Warner rejected Fox's offer the speculation was that Fox would come back with another higher bid. But last week during their 2nd Quarter earnings call, Fox said it would pull its offer and not pursue further. That sent the stock immediately down 12%. Throughout the week TWX shares continued to decline and came right back to our previous breakout level. That being the case I took the opportunity to add back the shares I had sold and now am holding another full position in TWX. Our stop will move up to just  under the breakout level and rising 20 WMA. There is also a small gap due to the breakout seen on the daily chart that could be filled before stopping our positions out. Here's the daily view:

When prices traded back to $72 on Thursday I pulled the trigger and was even able to catch the nice bounce we saw on Friday. We can't know for sure if this level/breakout will hold on this retest, but our risk is well defined in case we are proven wrong. A weekly close below $70.50 will be enough for us to step aside.

We are back in almost exactly the same position we were before the big surge and prices are still in uptrend resumption mode. The only thing that is different is that the market should now be aware that competitors for Time Warner feel their current and future assets are worth upwards of $85 per share. Regardless of the business games going on, this stock has been a strong performer over the past 5 years and price is still making higher highs in the uptrend.

Entering Berkshire Hathaway (BRKB)


When Wall Street asked the Oracle of Omaha, "What have you done for me lately", Warren Buffett responded with his largest quarterly profit ever. You can't really go wrong following along with Warren and his company Berkshire. This setup leaves very little to the imagination; its simplicity is its greatest trait.

What I love about this signal is that the stock is breaking out to new all-time highs while the market may be finding key trend support. That is a sign of leadership and relative strength that shouldn't go ignored.

We want to be long this stock above this breakout area and will use the weekly swing low at $121.70 as our initial stop. This trade looks similar to our HON trade a few weeks ago (hopefully this time is a different result). If this rolls over quickly I want to be alerted right away but also want to give it just a little room to wiggle down to that $121 swing low. We have an obvious trailing stop level in place where we could slide our stop up to should price hold here for a few weeks. The next stop location would move to just below our entry at $125.80.

This is an excellent risk/reward and allows us to ride the coattails of America's most successful investor.

Rotation Occurring 

Back in January it was Momentum that was being sold while Blue Chips rose. Now we are seeing growth rewarded and safety set aside. Interestingly enough this pullback seems most likely that, just a rotational pullback. Names like FB, TSLA, GILD, NFLX are holding at highs and have bucked the recent weakness, while more defensive and extended groups have been sold. Utilities and Industrials have been hit particularly hard, yet Discretionary seems to be gathering itself. 

This is not the typical formula for a massive correction. We may see that develop at some point, it just likely isn't now.

Being that we had significant cash reserves heading into this week I was able to put some to work in a couple of our existing holdings that were under capitalized. I took the opportunity to bring WFC and UNH up to proper risk sizing using the recent 7-10% pullbacks in both names. While this is not exactly to the plan, typically I like to buy strength, not weakness, I felt it was a good opportunity to take advantage of the key support areas being tested and maintain our risk per position at a very comfortable level.

When you see leading stocks pullback to retest breakout levels as the market indexes find support, that presents a solid opportunity to buy the dip. I am generally weary of buying more of a falling stock (simply because you have no idea of how much further it will drop), but when you see this confluence of levels coinciding with one another it can be a good risk/reward proposition.

WFC


UNH

Not all pullbacks are created equally. A pullback off of a higher high is significantly stronger and more reliable than one coming off of a lower high. Buying more of a stock coming down from a higher high is a better bet because the uptrend is still intact. If you are seeing a pullback off a lower high it is more likely to lead to another lower high and therefore a lower low, invalidating your position. You can certainly buy dips and still execute a trend following strategy, but those dips need to come from uptrending stocks making higher highs. 

Chart of the Week

Tesla (TSLA)

Tesla closed at a new weekly closing high this week and appears setup for more upside to come. It has the look of a strong cup/handle base formation and this week's breakout along with RS confirmation trigger that setup. The initial target for this pattern is $313, or 25% above current prices.

Tesla is one of my top individual holdings for my private accounts and I personally believe this is just getting started. Putting bias aside, the bullish thesis would be invalidated with a weekly break and close below $215. That would break the swing low, 20 WMA and rising uptrend support going back 2 years.

Here we have a stock that is broadly hated by investors (over 25% of the total shares outstanding are shorted), presents a disruptive technology for the future, trades at a very high P/E multiple (expensive valuation), and is currently at new weekly closing highs. That sounds like a recipe for higher prices to me.

Nothing in the stock price suggests that it will be weakening anytime soon, but ask most people and they say this is a bubble stock, the move has already happened, etc. This stock "had gone too far" back in May of 2013 and now prices are over 150% higher! This just goes to show that only price pays and you never can truly know where you are in a trend.

Do understand though that this is a mover and being that it is highly bet against, if something were to go wrong it could move equally quickly to the downside. But if you have a plan in place and manage your risk appropriately, this could be a nice addition to any portfolio. 

Saturday, August 2, 2014

We've Been Here Before

That was a tough week. But this is how markets behave and this is something we all have to deal with as market participants. They take the stairs on the way up, and the elevator on the way down. This week's price action says it all:


We have been here before haven't we? We have seen sharp profit taking a couple times in this recent bull surge that have tested the 20 WMA trend support. Each of the previous tests led to sharp recoveries immediately, will this time be different?

We always want to be looking for patterns in the market to see if the pullback/correction is part of the normal range of price movement, or if this is something outside the bounds of expected trading action. It is a fact that bull markets do a great job of shaking people out just in time for it to rally right back, leaving the overeager in the dust. If it doesn't immediately come back we will know that something may in fact be changing.

I have been waiting for the "inevitable" correction along with everyone else, will this bring that Wave 4 decline (here)? I don't know, but what I do know is that the market is telling us something and we need to listen.


--While the SP500 is testing its trend support area, a few of our holdings are showing relative weakness and need to be exited at this time. Know that this is PERFECTLY OKAY. This is exactly what I talk about when we need to listen to what the market is telling us by selling the weaker holdings and riding the strongest holdings. After a pullback we should only be left with the very best holdings in the market. That is a pretty good place to be in my opinion. Selling the losers and riding the winners, this is what makes you profitable over the long term.


HON
This is what we do. We find a low risk setup, we take our signal and we sell when the signal fails. If we are wrong, we are wrong quickly. We take our small loss and move on.

While HON is still within a longer term uptrend, the failed breakout and close below both the 20 WMA and prior support low is enough to make me think the consolidation needs more time. We will now watch from the sidelines.

PPG
PPG also sported the dreaded failed breakout and confirmed to the downside this week. This week's trading sliced through the prior support/breakout area, filled the gap from the first week of July and took out the 20 WMA. This one makes me a little bummed. I've held PPG for over a year and I have been willing to sit through some marginal breaks of support, but none have been quite this damaging. The big breakout failure is what really worries me here as that can lead to a very swift shift in sentiment.
All of the buyers on the breakout are now trapped and will be looking for an exit, creating potentially strong overhead supply.

There is still a solid long term uptrend support near $187 so I will want to see that hold on any test, and we will just have to see if this can setup for us again.

CMI
Cummins continues to be an excruciatingly difficult trade to manage from a volatility standpoint. It will spend 6 months grinding steadily higher and will then see all those gains disappear in one fell swoop. While this is still within the uptrend channel and did see some buy support, I feel I have given this every opportunity to prove something over the past 3 weeks and it hasn't even been able to muster a bounce. This week we saw a gap through the 20 WMA, a break of first support at $150 and within two days it had taken out the lower trend swing low at $139.36. That is enough for me and I will need to see some serious base formation before I consider this for a holding again.


But what if we are selling at the bottom? Well that's going to happen sometimes. We can only control so much and what we can control is the amount of risk we are willing to put forward to see if this stock is going to become our next big winner. If it doesn't then we will move aside and look for a better one. Remember the beauty of Relative Strength investing is that we get to change horses after each turn. This gives us the absolute best odds of picking the big winners in the end.

Well why don't we just hold because we own such strong companies? Don't get married to a stock holding ever! Yes these are all fantastic companies that have demonstrated they are market leaders for many years. But that is not what I do. I deploy a risk based market strategy; I am simply not willing to risk 100% of my money 100% of the time, as is the strategy with buy and hold. If something is not working and trading lower I will get rid of it and look for something else.

The mistake that investors typically make is that once they sell they think its over. What if we sell here and the stock turns around and goes back up? If that happens we will look for our signal confirmation of a resuming uptrend and buy them right back. This is why we have a watchlist, so we can continue to monitor the best and strongest companies. If we sell and it sets up again, we get right back in. No confusion, no remorse for having to buy back in a little higher. These things don't concern me and they shouldn't concern you. When risk becomes elevated you need to reduce your exposure to the most affected stocks and wait for them to prove that they are not in fact continuing lower.

We want stocks that are moving higher steadily and that offer us a very small risk for a potentially limitless reward. I'm not the guy who sits on a 20%+ loser and says "oh well, at least they pay a nice dividend". Hell no! On to the scrap heap they go and we look for a better one. To have success in the market you need a methodology that aligns you with the current trend and direction of the market. The best thing we can hope for is to follow along with the rallies and reduce exposure early in a declining cycle.

 Long term outperformance comes from protecting against big downside moves. It doesn't come from killing it to the upside during rallies. Anyone can make money during a bull market. The trick is to have a method to keep you in when things are moving higher and then alerts you to when things are ready to turn back lower.  

--With these portfolio adjustments we head into next week with holdings of:

20+ Year Treasury Bonds (TLT)
Starbucks (SBUX)
Gilead (GILD)
Time Warner (TWX)
Wells Fargo (WFC)
International Paper (IP)
Freeport McMoran (FCX)
Ford (F)
American Electric Power (AEP)
United Healthcare (UNH)