A Quick Word Concerning the Market
There will no doubt be a lot of chatter over the weekend about what Friday's market action will mean for the near term outlook of the stock market.
-Russian tensions are once again derailing the market
-The Fed is going to be rushed to raise interest rates due to raised economic forecasts
-The SP500 failed to retake the 50 DMA after todays test
-Whatever else can be seen as a negative heading into a new week...
BUT
One look at what is actually happening in the short term price action of the SP500 shows a very bullish posture.
30 minute bars

There is quite a bit going on here so let me just explain:
1. The pullback in late July completed a 5-wave pattern (orange trend lines) to the downside that completed as prices retested both the 1,900 breakout level AND 20 WMA.
2. At the low-peaks of both waves 3 and 5 (white trend lines) you can see that the MACD momentum was making higher lows on August 8th while price was making the 5th wave lower low. This is a positive divergence. Also of note, the MACD held above the zero line on both higher low pullbacks suggesting strong underlying support.
3. As price consolidated it formed a near perfect Inverse Head/Shoulder pattern which triggered on Wednesday and saw strong follow-through on Thursday. This confirmed the higher low from August 12th.
4. Friday morning prices advanced but then were sold back into the breakout level (important retest) on some more Russian headlines. This action proved that 1,944 is important support and it was a strong enough move down to shake out the frothy short-term traders who jumped on for an easy ride.
5. We then saw the lows for Friday set at the 1,944 support and price soon rallied 11 points to close well above the breakout level.
This is about as much bullish activity as one can hope for. From my view it appears likely that prices will move higher in the short-term and regain the lost ground from the prior highs. The red line is where resistance should come into play as that is a gap area on the chart which started the two-week pullback late last month.
If the 1,944 support does not hold, that along with the subsequent bullish pattern failure, I would become much more cautious going forward.
Open Position Review
Entering EcoLab (ECL)

A breakout to all-time highs while the general market holds support... This is what we look for as relative strength investors. We have a very clear weekly signal here with the break above the nearly 1-yr consolidation. The risk/reward is stellar as well. With the last 10 weekly closes above the $107.50 support and the rising 20 WMA there as well, we would not want to be holders below that uptrend support.
This seems like a steady trend resumption and with our initial stop only 5% below the entry, this sets up as a trade with significant potential. My position size is set at .5R.
TLT

Bonds blew through a very strong resistance level this week and now seem poised to retest the prior swing high from early 2013. You can see that price has been able to clear the 61.8% Fibonacci Retracement level which suggests that the prior swing high will be challenged.
TLT sets up for a short term momentum strategy that I call "Re-Capture". Once a pullback occurs from a significant swing point (peak in summer of 2013), price will bounce back to certain retracement levels of that prior pullback. A pattern that I have noticed is that once the final level is broken, the 61.8% retracement, price is pulled like a magnet to that prior swing point. This setup is very simple and is based on the short-term momentum in a stock. Once that last line of resistance is cleared, price tends (~65% of the time) to "recapture" the prior swing high. How I execute this strategy is to keep my risk vs reward as balanced as possible. Once the 61.8 level is broken, you enter the trade and place stops just below the 50% retracement level. I like to see that area coincide with the rising 20 WMA as well to support the uptrend further. Basically what it amounts to is a situation where you have a roughly 60% chance of success and then at least a 2-1 risk/reward on your entry. If you keep doing that over and over through time you will come out well ahead. Imagine flipping a coin and each time it comes up heads you win $2 and each time it comes up tails you lose $1. Well at a 50% success rate, that 2-1 payoff can really add up.
This is what I'm seeing in TLT right now. This week has triggered a Re-Capture trade. Because of the strength of this week's move the risk/reward is not quite as favorable as I would like at current prices to initiate this trade. But if you were to have a pullback into the $116 breakout area the risk/reward would come back in your favor and it would be well worth an additional entry point.
Through my data on Re-Capture scenarios I do notice that the stocks that make the strongest moves through the 61.8 level (those that make the risk/reward for entry not as favorable) tend to have a very high success rate. But I still like to see that R/R closer to 2-1, and on a pullback that will be easier to achieve.
TWX

Time Warner had a solid bounce back week and now is in the process of "gap-fill" mode. You can't see it on the weekly chart above but the daily chart shows the huge gap lower price made last week. Markets tend to like to fill gaps in price and if this is the case we should see that $85 challenged soon. There is nothing to overthink here, price broke out of a long-term base formation, pulled back to retest the level, and is now bouncing higher. That is just typical uptrend breakout behavior. Stops should be just below the breakout area at $70.50.
SBUX

Despite all the motion in the major market averages, SBUX has maintained a very steady consolidation of the recent upward move. Price is orderly retesting the breakout area near $77 and seems likely to push higher should the market find its footing. Stops are just below the 20 WMA at $74.30
IP

IP has been challenged recently and is battling with its stop level and 20 WMA. There is still some room below prices but its going to need to get moving soon if it is to remain in our portfolio. So far the action suggests more consolidation ahead rather than a strong breakout move. A close below $46.30 will end this trade for us.
VZ

VZ is in a similar position as IP. This just goes to show that no matter how much personal conviction you may have about a position, the market will ultimately do what it wants. When VZ was ripping higher 3 weeks ago I was feeling pretty darn good about the position. Since then however price has suffered a hideous reversal and is flirting with our stop level for two consecutive weeks. So far $48.50 has held and is seeing buy support. But it better get a turn and get on it very soon or we will be saying bye bye.
WFC

WFC found trend support this week and put together a little bounce. $50-49 is still a strong support area, so as long as that is intact the uptrend is on firm footing. Below $49 things get dicey.
BRKB

Berkshire looks fantastic showing strong follow through to another all-time high this week. Relative Strength has surpassed the final downtrend resistance and this seems poised to move higher. Stops can now be trailed higher to the $125.80 consolidation lows. I love a breakout to all-time highs when the market is bouncing from trend support. BRKB is a relative strength winner and this week's action puts that on full display.
UNH

Much like WFC, UNH has found trend support and saw a nice bounce back this week. We want to be long and strong above this uptrend line and prior lows near $79.
FCX

FCX is doing its best to test our patience, but it has the look of just a standard throwback type move. There is no harm to the uptrend here as we still have higher highs and higher lows and price is above the 20 WMA. A close below $35 will be enough for me to think this is more than a retest scenario and I would reevaluate my position at that time. Above $35 though and I still think FCX has solid potential.
ENB

ENB just keeps doing what it needs to by holding all key levels at each juncture. This week price bounced off the cup/handle retest area and I think this is headed much higher. The measured move target for this base formation is near $57. I would want to ride full positions right here and we would reevaluate the holding once that initial level is acquired. Stops should still be placed below the handle swing low at $46.80.
GILD

Along with BRKB, GILD appears to be our strongest current holding. Since breaking out 7 weeks ago price has motored higher, continually making new all-time highs. With this week's surge we can move our stops to the breakout level at $84. This trade essentially has zero risk for us now as our stop level is right near our entry point. That's not a bad situation to be in; a monster stock making new highs each week with relatively zero risk of loss. You would be hard pressed to find a better investing scenario in the market today.
F
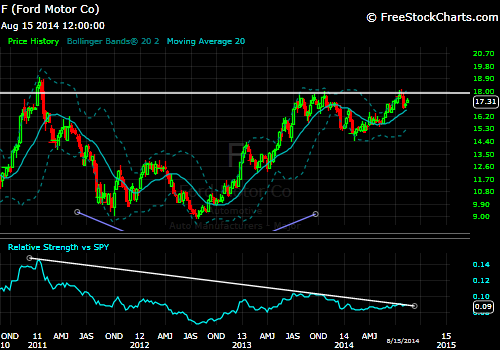
Ford is this close to triggering a series of massive base formations. A strong weekly close above $18 coinciding with a break of the long-term RS downtrend would be a very positive signal for us. I will be taking that opportunity to add aggressively to current positions.
Ford is also a key member of the Consumer Discretionary sector which I tend to favor right now and a breakout here could be very good for the group as a whole.
---Speaking of Discretionary stocks breaking to new highs, take a look at HD right here:

Home Depot is just poking its head above its prior all-time highs resistance zone. There is a lot to like here should this breakout see some follow-through to the upside. They announce earnings on Wednesday, so next week could be the catalyst HD needs to break through this key level.
I love this setup but also find myself with 3 XLY stocks already in the portfolio and I do have a rule that I don't want to own more than 3-4 stocks in any one group for diversification reasons. I will have to evaluate HD once this level is cleared to see how it may fit into our plans here going forward.
Again I will reiterate how much I like this sector at current levels. We currently hold positions in TWX, F, and SBUX. But it is noteworthy that HD is attempting this massive base breakout, DIS is continuously making new all-time highs, FOXA is challenging highs, as is PCLN. So there is a lot to like about the setups in the Discretionary space. Its definitely something to be keeping an eye on going forward.
No comments:
Post a Comment