Saturday, October 31, 2015

Lg-Cap Portfolio Entering General Electric (GE)

Friday confirmed the Monthly close for October. While the recent market volatility has left many Daily/Weekly charts wide and messy, the Monthly charts help smooth that noise a bit and are reflecting some substantial breakouts for the market to rally behind.

+Entering GE
It appears that the Monthly chart for GE is breaking out above a 15-year downtrend. This breakout comes after a ~500% rally off the '09 lows. However the stock has gone nowhere since 2014, consolidating the large gains in an orderly manner. 

Zooming in on the same chart, you can also see that this month the stock broke above its 61.8 retracement from the '07 decline. Often when this resistance level is overcome the stock tends to drift toward the prior high and 100% retracement of the decline. 

A strong risk/reward equation is in play here as we place our stops for this setup just below the 50% retracement level, in this case at $24. The trade effectively risks 12% (distance from breakout to the 50% retracement) to gain 38% (distance from breakout to the 100% retracement and prior high). That's better than a 3-1 ratio and I'll take that trade every time. 

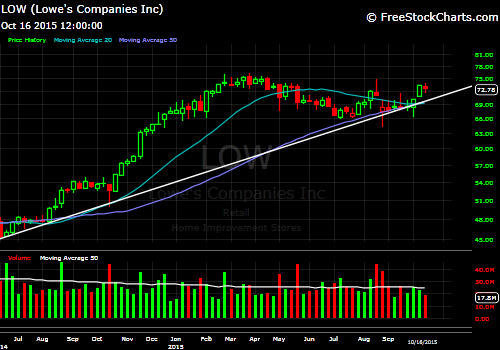
Our indicators also suggest a positive pattern for prolonged upside from here. Two big spikes in buying volume have appeared in the last 6-months showing accumulation of the stock. The Monthly MACD line has pulled back to the Zero support area and is turning higher. Also Relative Strength vs $SPY broke above a multi-year downtrend. 

We like to own stocks coming into favor after a prolonged base formation. GE has the look of a successful entry here for longer-term holders. 

Our current Lg-Cap holdings are GE, COST, LMT, FB, GOOGL, Short AXP

Long-term Thinking in a Short-term World

This week I want to do something different than my normal recap. I don't usually share my shorter-term trading information, but I needed to work through some numbers this past week and came to some notable conclusions.

We live in a short-term world; we want things fast, accurate, and actionable. But we often neglect the longer-term results to appease these short-term desires. This past year markets have been mostly directionless and with heightened volatility. For a trend trader, regardless of timeframe, it's been a difficult market for many. 

Because of this fact I wanted to look over my recent trading results to see if I could do better than my current trading suggests. YTD my short-term accounts are down -3.2%. I'm not pleased with this. I've done worse in the past, but I've done better also. I wanted to figured out when did my best trading spans occur, and under what market conditions (both the broad market and the stocks themselves) did my performance either flourish or falter. 

So here is what I did. I broke the broad market into two periods, either with a rising 20 WMA or with a declining 20 WMA (using the SP500). Then individual stock positions were measured from the entry price to the 20 WMA on entry. The thinking being that I wanted to see if trades were performing better during times of higher momentum or after a pullback. Individual entries were broken into two categories either < 10% above the 20 WMA or > 10% above the 20 WMA. 

Note: the current environment has been one of a choppy range bound market. These results may differ in a stronger trending market. However we have had a few strong moves this year to extrapolate data from. 

Results: 

I have taken 61 trades this year. 25 winners and 36 losers. That's a total win rate of only 41%. Certainly this leaves much to be desired. 

-Positive Sloping 20 WMA for SP500
Trade entry < 10% above the 20 WMA 
16 trades (11 wins, 5 losses) 68% winners. Return +5.53%

Trade entry > 10% above the 20 WMA 
15 trades (7 wins, 8 losses) 46% winners. Return +.62%

-Negative sloping 20 WMA for SP500
Trade entry < 10% above 20 WMA 
17 trades (6 wins, 11 losses) 35% winners. Return -1.32%

Trade entry > 10% above 20 WMA 
13 trades (1 win, 12 losses) 8% winners
Return -8.08%

The results are helpful. Maybe obvious to some, but helpful for reinforcing good trading habits none the less. 

Ultimately all gains came while the SP500 had a positive sloping 20 WMA. All losses came while the slope of the SP500's 20 WMA was declining. Trades with a +20 WMA  returned +6.15% and a 58% win rate vs a -20 WMA -9.4% with a 23% win rate.

Individual trade results were much stronger when entries were made closer to the longer-term moving average. Trades taken within 10% of the 20 WMA showed a return of +4.31% and 51% win rate, regardless of market direction. Trades entered more than 10% above the 20 WMA returned -7.46% and 28% win rate. 

Conclusions: 

Despite all the feelings of "missing out" during volatile market conditions, odds simply do not favor my strategy when the overall market trend is declining. Had I simply not taken a single trade while the 20 WMA was declining I would have a solid gain on the year. This also would have occurred despite not taking a single entry signal on this recent 5-week 200+ point rally in the market. (The 20 WMA for the SP500 remains with a negative slope). 

The data also suggests that when entering new trades, the most profitable and highest odds trades setup closer to the longer-term moving average. 

The combination of taking Long trades after some consolation/pullback AND while the overall market is in an uptrend, is the highest probability for a successful trade. 

Conversely, the combination of entering Long after a sharp move higher while the overall market is in a downtrend is a disastrous proposition for returns.

There are times (like this past month) where shorter-term trends can emerge and offer profitable trade opportunities while the longer-term trends are negative. A way to navigate this environment, knowing the odds generally are working against you, is to simply reduce your trade size during those conditions.

For example new trades entered when the longer-term trends are in your favor can be taken with a ~1% risk per trade. While new trades entered when longer-term trends are not in your favor should be sized smaller, maybe .5%-.25% risk. This way you can still take new trade signals regardless of market direction but will also be adjusting risk accordingly to the more or less challenging environment.

There is no right or wrong way to trade. But it is very helpful to understand when your strategy is in favor and out of favor. Either choose to only trade when conditions are the most favorable or have risk measures in place to adjust if conditions become unfavorable.

The takeaway from this little study is that regardless of what the action in the market is and despite the media's focus on the day-to-day gyrations, knowing when your strategy is most successful and maintaining the discipline to only trade during those times will work wonders on your long-term results.

When it comes to investing, we should gauge ourselves on our longer-term expected returns. It is and will be very tempting to take trades regardless of general market direction. The important thing to realize though is that by getting pulled in by the short-term movements and emotions involved with watching the market too closely, you will be neglecting your long-term returns for short-term emotional stimulation.

Good investing is based on sticking to high probability trades and situations; good investing should be boring. I would encourage you to go through your trade logs and begin to understand exactly when conditions are most favorable to your strategy's long-term results. Even if you know what the answer is before you start (its pretty obvious that when the market is uptrending that trades are higher probability), having the data to back up your actions will go a long way to helping your confidence when your returns may lag for periods of time.

Thanks for reading 
-ZT

Saturday, October 24, 2015

Observations; Entering $FB and $GOOGL

SP500 has easily regained several key resistance levels. 

SP500 Daily

- Price has returned to the prior range and is now back "at the scene of the crime"
- Currently price is above the 200 DMA (yellow) which is also rising.
- Double Bottom pattern from 8/24 and 9/29 is in motion targeting new highs.
- Resistance should remain within the prior trading range. 

SP500 Weekly

-Price has retaken the 20 WMA which is still declining
-Lower Low/ Potential Lower High on weekly timeframe still in play until a new breakout can occur.
-Volume broke its 3 week downtrend, posting an accumulation week.

 -Many strong new breakouts are occurring

+ Entering Facebook
Facebook moved to all-time highs this week on increasing volume. The stock has shown good resiliency by managing to hold above its prior range. It now looks like a successful retest/consolidation of the early summer breakout.

Initial stops will be placed below the retest/consolidation at $86 on a weekly closing basis.

+ Entering Google 
Google posted strong earnings this week and the stock has moved to new highs. Similar to FB, GOOGL built a consolidation pattern above its prior range and is now resuming on increasing weekly volume.

Initial stops will be placed at the recent swing low at $617.

MCD

GE

AMZN

MSFT

HD

PEP

PM


-SPDR Sector Top 10 holdings remain 2-1 downtrending vs uptrending.

The majority of the top 90 stocks in the SP500 look like this:

SLB

PG

CAT

XOM

PPG

MON

MS

The charts above, and 2/3 of the Top 90 SP500 stocks are displaying downtrend behavior. Some are holding better than others, but the majority remain under pressure and should act as a drag on the major indices.


-The VIX has been crushed and is now back in a low volatility state


Bottom line: Markets have rebounded strongly to the surprise of many (myself included). The majority of the most heavily weighted stocks in the SP500 remain under pressure, but more new breakouts are appearing each week. 

As always we try to focus on the leaders. With the market sitting in the middle of its year-long trading range I prefer to be positioned in names that are already through their highs, and avoid those that are near or just bouncing off recent lows.

For the last year or more, most new breakouts have been sold following their moves to new highs. Recently however real leadership is emerging. These leaders are identified as those which held up better than the majority of stocks during the recent decline. They built solid bases to rally from once the market bounced back. 

When markets correct, the best way to spot potential leaders is by seeing which stocks build bases near their highs and which ones just crumble under the pressure. Once markets stabilize those that built bases will regain new highs quickly. While those that breakdown will simply bounce in a counter-trend way.

Thanks for reading
-ZT


Saturday, October 17, 2015

Lg-Cap Watchlist

Not much changed this week. Markets were able to grind their way higher and the short-term Double Bottom pattern has moved above the swing high from 9/17. Should this formation prove successful the measured move targets suggest prices back at new highs. 

SP500 Daily Double Bottom


The setup will likely not be easy to complete as the SP500 is now just below the declining 20 WMA and range resistance. We've looked at this many times and continues to shape the intermediate term thesis.

SP500 Weekly
While most are convinced that sentiment is bearish, I continue to be surprised by the confidence many are giving to an "end of year rally". It's basically assumed now that markets will just rip right back to the highs. Granted we do have some price confirmation of this theory (Double Bottom in motion), but for more than a year now this market has squashed many a bullish setup shortly after the herd piles in. Short-term the price action remains constructive, but confidence appears high to me, especially considering we have rallied almost 200 points in a little more than two weeks. 

Regardless of what we think will happen, keeping an open mind is very important for successful market performance. That being the case, should the market be able to surmount this overhead supply level, there will be many stocks within our Large-Cap universe that setup for potential upside and favorable risk/reward. Here are some I like and will be watching.

FB
MCD
HD
LOW
PEP
DHR
UNH
ECL


Sunday, October 11, 2015

Lg-Cap Update: Entering Costco and Lockheed

Markets continued higher this week. We have now seen a 150 point rally in 9 trading days. There is also a lot of talk of a Double Bottom formation.
Depending on how you were taught pattern structure some may say the confirmation is based on the closing price of the swing high, while others would say it has to break the highest point. If you use closing prices, the pattern is in motion. If you use the highest intra-day price, we are now testing the neckline. Either way can't rule out this scenario, as constructive price action has occurred at initial resistance areas (i.e. 50 DMA, prior range closing high, VIX < 20)

However the intermediate-term trend remains negative. SP500 weekly view:
 Price is now approaching the declining 20 WMA for the first time since the breakdown in August. Seeing that this average has been strong support for the entire bull run, I would expect it to act as resistance on the way back up. This will be a key level to watch.

Another item of note is that lagging sectors have been leading on this latest rally and are also nearing their declining 20 WMA's:

Energy (XLE) Weekly
 The Energy ETF has tested the 20 WMA during this decline a couple times. The first test failed quickly while the second test briefly broke through, but soon resolved lower. It will be interesting to see how this third test is handled. By my basic wave count it appears we are seeing a potential wave4 rally and that a wave5 decline will likely follow.

Materials (XLB) Weekly
Materials haven't quite tested the 20 WMA but have rallied furiously over the last two weeks. The XLB has gained ~15% since the low last week and remains in a strong downtrend.

When lagging sectors lead a bounce within a downtrend its often a sign of overall weakness. Only time will tell if this rally is met with sellers, but risk remains elevated.

The bounce has been strong and some new signals are triggering, however we still remain below the prior trading range from most of 2015.

SP500 Weekly YTD
The big test for this market will be this prior support, now resistance at 2040-2060 

The recovery is dragging most kicking and screaming back into the market for fear of missing another end of year rally. This is occurring likely just in time to rollover again, fooling the majority who are convinced the correction has run its course. 

 While there are new entry signals being given, risk remains elevated in the intermediate term. As long as the 20 WMA is declining, and especially while price is below that level, rallies remain suspect. Because of the heightened risk, all new positions require smaller than normal trade sizes. What would normally be a .5R size per trade, is now a .33R size until trend conditions improve. There has been progress but we still aren't there yet. 

Our Lg Cap Portfolio is entering two new positions: Costco and Lockheed Martin. We also remain short AXP. 

Entering COST
Costco has been on our watchlist for some time due to its intriguing base setup at all-time highs. This week the stock saw strong upside action to close at the highest weekly closing price ever. We can place our initial stops at the low of two week's ago and rising 20 WMA at $142. This has been a key inflection level for the stock within the trading range for the last year. I think the stock sets up well above that area.
 
Entering LMT
Lockheed is in a similar spot as Costco above. Its another stock that we have been watching as its base was largely left intact despite the wide ranging bar from late August. The stock then consolidated tightly at that upper end of the range and this week made new all-time highs. In a market full of uncertainty, this is the best signal we can receive. A new high tells us more upside is likely over the intermediate term. We will use the low from two weeks ago as our stop at $199.

Short AXP
 AXP remains below our $78 weekly stop level despite the strong rally in the market. It is once again testing the underside of its declining 20 WMA and the overhead supply level. Below this area I have no problem remaining short the stock.


The current price action in the market suggests we should put on a couple starter Longs for the first time in a while. We will do that, but we still remain in a roughly 75% cash position. Our new Long entries bring our allocations to 15% Long, 10% Short, and 75% Cash. 

When the market is under pressure it is best to remain patient and let opportunities come to us. There are still very few setups showing healthy price action. The recent rally helped that a bit, but there is much more work to be done before the "all clear" signals are in place. 

Many have been very quick and confident to call a bottom with this current action. But as long as large overhead supply exists and major moving averages are above price and declining, the market will likely be volatile and challenging. 

The bottom line is we need to stick to our system's signals, but until more consolidation repair is done the market remains vulnerable.

Thanks for reading
-ZT


Saturday, October 3, 2015

The Secular Road Map

Everyone wants to know if the correction is over or if it's just getting started. Is this the end of the secular bull market for stocks? Are we on the cusp of a major bear market? Nobody knows the answers to these questions for sure. We may have hints and statistics, but the market can and will do as it sees fit.

So how do we navigate when we don't know which direction the next 10-20% move will go? First of all we follow the price action. What are the trends telling us? Are the Longer, Intermediate and Short-term trends still moving higher? Second we look for hints in the overall environment to guide our process.

SP500 Monthly (Long-term)
 Looking back at the last 20 years it appears the market still has its long-term upward trajectory. The long-term, secular trend remains intact.

SP500 Weekly (Intermediate-term)
 The weekly view shows the first declining 20 WMA since 2011. Price has not recovered from its initial decline in August and is guilty until proven innocent. The intermediate trend is bearish.

SP500 Daily (Short-term)
The daily timeframe shows similar trend damage as the weekly, but also that there is a new trading range forming between 2000-1870. Price could certainly move higher over the short-term and retest the upper range and declining 50 DMA.

When you consider these three timeframes it appears to me the market remains in a short-term to intermediate-term correction within the context of a larger bull market phase. Sticking with this assumption I believe we are in a very typical 4th-wave correction within a larger 5-wave uptrend. 

5 waves bull phase (currently in wave 4)
This is certainly an interpretive look at the price action, as is the problem with Elliot Wave Theory, but it does provide a basic framework to draw from. The 2011 correction formed wave 2 in our sequence. I wouldn't be outrageous to consider a similar movement to around the 50 MMA as the projected target for this wave 4 correction. Currently the 50 MMA sits near 1,700, a test of that area would still be considered normal corrective behavior within the larger bull market.

If we stick to more traditional technical analysis we can look to the concept of polarity. Polarity suggests that when a level has acted as strong resistance, once broken it should then become the new support.

Secular base breakout at 1600
 There was clearly a resistance level at the all-time highs near 1,500 going back almost 15-years. In early 2013 the market broke through that resistance level and we have been riding that breakout up until the last couple months. Classic technical analysis suggests an eventual retest of this breakout. This doesn't mean it has to happen now, but it would fit the current setup within our theory.

While the media wants to categorize everything into a neat fitting box, regardless of whether the current correction becomes a "bear market" or not isn't really important. What is important is understanding the context of the moves within the larger timeframe. Saying that if the market declines 20% its a "bear market" doesn't tell us much about the actual trends in place. After a 300% rally, a 20-30% correction isn't that unreasonable and it doesn't change the fact that the market remains in breakout mode.

This is where the concept of cyclical vs secular movements come into play. As we have seen before the market can have shorter-term, cyclical bear markets within larger bull markets. Its certainly possible based the intermediate trend declining that this becomes a "bear market" in the eyes of the media and gives investors a good scare before it ends. But its also possible once the correction plays itself out that the long-term bull market continues.

What all this amounts to is KNOW YOUR TIMEFRAME. If you are a trader then you should be able to find many opportunities created by the volatility of the shorter-term trading range. If you are an investor there is cause for some caution over the intermediate term, but until the breakout near 1,500 fails its likely best to continue to be patient. 


--Here are a list of stocks that are holding up remarkably well and are supported by large bases. Its important to monitor the strongest stocks during a correction. Once the correction ends, these names tend to lead to the way back up. These are a few of the Lg-Cap stocks I'm watching for our portfolio.

COST

UNH

 HD

 LMT

FB

Thanks for reading.
-ZT