Previous comments from the original post will be in [brackets]
[I have been beating the drum of patience and caution recently. Today I am keeping an open mind and just looking at some prominent names from our watchlists and portfolios that are currently sitting on what appear to be major support levels]
UNP 10/29/2018

UNP current- The stock has bounced around but has basically gone nowhere. Although now it is below the 200 Day SMA and potential Head/Shoulder Top formation setting up. $136 is key support

UNH 10/29/2018

UNH current- Now testing the 200 Day SMA for the first time since early in the year. Price continues to hold support for now.

FANG 10/29/2018

FANG current- Major support breakdown and set to invalidate the Monthly trend at the close of Dec

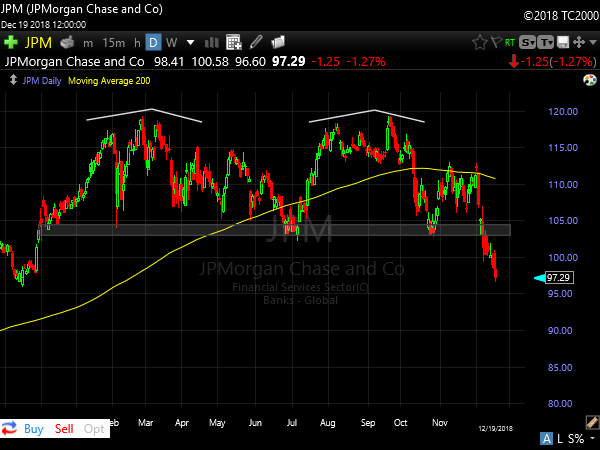
JPM 10/29/2018

JPM current- Double Top triggered after a bounce into the falling 200 Day SMA. Trend failing
FIBK 10/29/2018

FIBK current- Breaking major support. Oversold near-term, but below $38 is bearish

HD 10/29/2018

HD current- price has chopped around with little progress and is now back testing the major support

QLYS 10/29/2018

QLYS current- Price has held support and built a base. But now looks to be struggling at the 200 Day SMA and could trigger a large Head/Shoulder Top if it can't hold the $70 level.

AER 10/29/2018

AER current- After a bounce to the 200 Day SMA, price has broken support and looks like a Head/Shoulder Top in motion now. Very oversold near-term but price below $49 is bearish

ILMN 10/29/2018

ILMN current- Continues to hold support and the 200 Day SMA

TWTR 10/29/2018

TWTR current- Price holds well and made a higher swing high recently, yet it is struggling with the 200 Day SMA.

ALRM 10/29/2018

ALRM current- Recovered well from the initial plunge but still struggles with resistance. Still an intact trend for now.

FFIV 10/29/2018

FFIV current- Price is breaking below the 200 Day SMA and support lows. This looks like a Head/Shoulder pattern in motion.

GWPH 10/29/2018

GWPH current- Price has failed major support and is now rolling lower

M 10/29/2018

M current- Price is sitting just below key support and breaking below just in the last couple of days. Note the stock continues to hold the gap area from May and filled the gap early this week.

JAZZ 10/29/2018

JAZZ current- Failing the large support area

GBCI 10/29/2018

GBCI current- After rallying strongly to new highs the stock has fallen -18% in 12 trading sessions. Now it is approaching major support once again.

CIEN 10/29/2018

CIEN current- Price has performed well despite this poor market. Good leader here

[These patterns can go one of two ways: Either we see support hold and this could be a tremendous buying opportunity OR support fails and in that case many of these look like massive topping formations.
With the size of correction many of these names have seen recently there is likely a strong relief rally ahead. Using this support as the basis of that thesis could prove a strong risk/reward.
I am a big believer that we don't need to be the first ones in on a move to make money. There is very little reason to shoot from the hip trying to catch a low that we "hope" holds. Instead I prefer to watch the price action, identify key levels of interest, and wait for confirmation.
If prices can hold this support we will likely see new rotation patterns trigger that we can trade for a pop. If prices fail these levels then it is likely we are headed for a more serious downtrending market. Some big names have already failed key supports, most notably Semiconductors as a group (SMH). We will want to see the remaining support levels above hold if the Bulls want to push for a year end rally.
Keep these levels in mind and trade what is actually happening in front of us rather than what we want to "think" should happen. Be ready for either outcome from here and keep an open mind.]
*The updated looks of these charts for the most part show degradation with the exception of a couple. The concerning thing I see is that despite the poor market and current correction depth, we are still seeing fresh breakdowns of large support in many of these names above. This would suggest plenty more downside could be ahead for the market overall.
To reverse this negative outlook we would need to see prices move back over the broken support levels and start to make higher swing highs


