Sunday, July 31, 2016

Lg-Cap Portfolio Update

The SP500 staged an impressive breakout on the monthly chart for July. It doesn't matter what data points you show me, this is bullish price action and bull market continuation. We are Long.

SP500 Monthly


Our Large Cap Portfolio added a new position in GOOGL at the close of July and is now fully invested.

Long: FB, GE, AEP, PCG, PM, UNH, SHW, MDT, MSFT, CVX, LOW, VZ, CSCO, COST, CMCSA, PEP, GOOGL

Short (via Put Options): BAC, C, GILD

Our posture is quite diverse and bullish. We hold many higher yielding assets as well as some growth oriented names. The few Short positions we hold still reflect the longer term price action, although it should be noted our Bank Puts are mostly dead at this point. We will still hold them as they expire in  September and there would be very little added benefit to selling them now.

LONG

FB
Facebook reached new highs this month after thrashing earnings estimates once again. The stock faded following the initial reaction but was still good enough to finish July at a new monthly closing high. We can now trail stops to the low of the recent consolidation at 104.40.

GE
GE faded at what is clear overhead resisitance. The $33 level goes back to major support prior to the Financial Crisis. It may require more backing and filling in this range before it can make another run at new highs. For now we still have higher highs and higher lows and will await a higher monthly close before we trail stops further.

AEP

PCG


Both AEP and PCG made new highs this past month but faded the last couple weeks. There is really nothing to do here even though these prices are getting a little stretched. We could use some consolidation before we are able to trail stops again.

I actually trimmed a little off on Friday (1/4 position) mainly to cover costs of our new GOOGL purchase. There is no need to do so technically but I felt these were the most vulnerable names to a pause at current levels. I joke with myself when I say "how do you insure that your stocks continue higher? Sell some of the position". More often than not it seems stocks always continue to rip once I trim exposure. Needless to say I would be fine with more upside from here, but realistically a defensive group like Utilities tends to revert once it becomes more than 15% above its 20 MMA.

If we are indeed entering a new secular bull market utility stocks would be a source of funds for managers looking for more growth. Just keep that in mind as we go forward. While they could always continue higher, intermediate-term we have had a great run and some rotation of funds into higher growth may be a fine play.
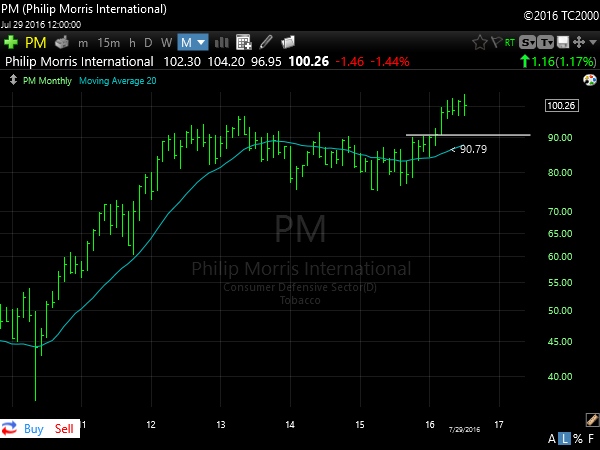
PM
PM is just flagging above its prior highs. A resumption higher soon could allow us to trail stops, but for now we will let this rest after a monster run.

UNH
UNH continues to stretch out. Nothing to do here until it cools off and forms another base. Letting it run.

SHW
 Sherwin had a volatile month but closed well off the lows. With the new monthly closing high we can trail stops to June's lows at 278.74. This is a nice little flag breakout and should be suggestive of higher prices to come.

MDT
Medtronic has been a ripper as its emerged from its 18-month base. Nothing to do but hope it pulls back and builds a higher low to trail stops.

MSFT
MSFT broke out of a multi-month bull flag in July and allows us to trail stops to the June low just above $48. If we were not involved already, this would be a place to initiate a new position. Since we are long we can trail on up to the new higher swing low.

CVX
Cheron continues to hold above $100 support. Oil looks a little vulnerable here if support should fail, but overall CVX is hanging in there well.

LOW
Lowe's finished the month at all-time highs We are keeping stops where they are for now but it is nice to see it moving in the right direction.

VZ
After the recent spike VZ is consolidating at the highs. We are giving this plenty of room to wiggle as the long-term setup is very much in our favor. That and we are being paid more than 4% just by owning the shares.

VZ is a solid foundation for any long-term income/growth portfolio.

CSCO
"Old Tech" is seeing strong rotation, MSFT, INTC and even CSCO are steadily pressing higher from major multi-year base formations. Considering the high dividend payouts, these remain very strong positions and could just be getting rolling.

CMCSA
Comcast continues to stretch its legs and push to new highs. This is getting off to a very nice start for us and is a leader in the new leg of the bull market.

COST
Costco showed some strong follow-through after our entry signal last month. After a 2-year sideways period COST could be ready to press to new highs.

PEP

Pepsi pressed higher this month and is now in a position to allow us to trail stops. We can use the new higher pivot low at $100 as our trend invalidation point.

+GOOGL
Our new addition for the month of July is Google. After 9-months of consolidation the stock broke through downtrend resistance and set a new monthly closing high. Earnings last week were strong and the Street rewarded them. This is exactly the type of "bull flag" setup I look for and is emblematic of a new trend beginning.

Initial stops will be placed at the new higher low at $672. It seems like a wide stop but remember we are not hoping for a 10% pop in the stock. Our objective here is for much more upside than that. With a trend this strong we want to give it plenty of room to develop in the future.

SHORT

BAC

C
Banks are acting quite well over the short-term, the longer-term however still shows quite a bit of weakness. Unfortunately for our Put positions we may run out of time before we get follow-through lower.

The recent market strength has seen solid participation for Financials which is to be expected. It will be interesting to see what comes of the next few months. Should Banks continue to churn we may look to roll out to further dated Puts or step aside completely depending on further money rotation. But for our timeframe here these names still remain largely weak.

GILD
Gilead looks like a solid bet to continue lower. With a poor earnings reaction this past week the stock took a tumble. We are now only 5% from our Put strike at $75. It doesn't mean we will sell there, but we will evaluate the situation. We have until October before our contracts expire which gives us plenty of time to let things develop. So far, so good.

Markets are pushing higher into the summer and to most people's surprise. There remain many skeptical of the recent breakout and positioned poorly for higher prices. We continue to be undeterred from their malaise as we have been steady buyers since the March recovery. As long as prices remain firm and the market is in an uptrend we will stick with our holdings and participate.

The time to take our foot off the gas was back in August 2015. Markets churned for 10-months following that breakdown and now we are seeing the exact opposite...new highs. Now we put hammer down and trade this market aggressively. Sure there will be pullbacks along the way, but for now prices are pointed up and we are along for the ride.

Thanks for reading
-ZT

Wednesday, July 27, 2016

Monthly Signal Watchlist

Growth

ORLY

 SIRI

SFLY

VRSK

MTX

PNFP

ICLR

DORM


Lg-Cap

AMGN

INTC

GOOGL

SBUX


Sunday, July 17, 2016

Some Trades and Thoughts on the Week

We came into the week heavily Long and we enter the weekend in a similar posture. 

Short-term accounts were 80% invested heading into this past week and are currently 85% Long, although we did some adjusting and took advantage of a couple opportunities that came our way. 

Longer-term accounts were invested 90% coming into this past week and are in about the same position as they were, but with a couple new moves.

Short-term Swings
In the very near term the markets are extended, everyone and their Mother knows that. However the price action (in our holdings at least) remains pointed north with constructive consolidations later in the week. 

TWTR

Twitter continues to work off supply in the 18 area. The trend remains solid and an orderly consolidation has formed once again.

SHW

Sherwin has made a swift move to its prior all-time high and used the past few days to work sideways. This is still a positive structure for continuation. 

SCTY

I've been buying SCTY as a spec trade following the recent buyout rumors from Tesla. The short-term action continues to coil and press against the high end of the range. 

Friday's move through 24.80 is a good start as the stock could pop once it breaks through resistance. I like this position as it seems to have a strong "buyout put" providing underlying support for the stock.  
ACIA
I've had a position in this recent hot trade and on Thursday it gave us the chance to beef up our size for a quick move. 

Thursday created a nice tight flag following its bounce on Wednesday afternoon and the stock popped to the upside. Friday morning offered us some strength to scale back this aggressive play and we booked a nice gain on the opening gap up.

FONR

FONR has been on fire recently and we have been participating. Following our quick trade in ACIA, this stock gave us a similar setup and we rolled the proceeds from ACIA to add to FONR Longs Friday morning. 

While the stock closed off its intra-day highs it is still in a constructive posture for more upside and we remain in our aggressive swing position. Honestly the way it closed the day we will add again on this little flag if it resumes Monday morning. 

With these continuation trades we can keep going back in on any viable consolidation. They are the gift that keeps giving (until they don't) and should be treated as such until the momentum changes. For now it remains in place. 

Trimmed TSN into resistance 

TSN has been a smoker since our aggressive swing entry following the downtrend breakout. It is now right into its prior highs after a very impressive run. While it appears this could still press higher, my plan was to reduce some exposure into this resistance level and reevaluate once we see how it behaves up here. We did that on Friday. I took my standard 1/3 position off and will see what comes of it. 

Any time we reduce a winning position we also want to be sure we continue to hold a portion as we never know when a trend will come to an end. Leaving a "runner" portion is a very good way to continue to participate in further upside while acknowledging more rough sledding could be in store over the short-term. 

You'll never see me blow completely out of a position that's moving in my favor.
It's always best to let the trade run and wait for the market to prove the trend has in fact come to an end. 

Lg-Cap Add/Subtraction

-Reduced 1/3 GE into next week's ER, following swing add and target capture.


GE has been on an impressive tear the last few weeks and now is smack into major overhead resistance from before the Financial Crisis. I added shares following the weekly trend signal on 6/12 . We decided to take 1/3 off and run the remaining holding which is an overweight holding. Half of the position will use a weekly stop at 29.79 and the rest on a Monthly close below 27.10.

+Added to CVX

While we reduced some excess exposure in GE, we ended up rolling the proceeds right into a new add for our long-term CVX position. 

Following a 12-week flag into the rising 20 Week SMA, CVX popped through the highs and resumed its trend. On this new overweight portion we will use a weekly close below 99.50 as our stop. 

Growth Weekly

+We added a new position in CNK


+Increased current longs in TXRH and trailed stops

While my intuition and rationality told me to scale back risk this week, price action told a different story. So I did the uncomfortable thing and ended up adding net exposure rather than reducing it. As Charles Kirk said in last week's weekend report to members:

"Remember, the market is not there to make you feel nice and comfortable. If you seek out comfort, you will not succeed in trading. By nature, we must train ourselves to seek out discomfort as that is where the opportunities to profit most always reside. Always keep this rule in the back of your brain."

In my mind the comfortable thing to do right here is to sell half of everything I have. Take some profits on very strong trades we have had over the past year, reduce some of the winners and wait for the next pullback to buy them back cheaper. De-risk is what's "safe" at this point. But the market rarely rewards safe and secure. Especially when it moves above a 2-year trading range and then sees zero selling, blasting to new highs in a relentless vertical ascent.

So you must ask yourself, what makes the most sense right here? What do I think should happen next? What feels the most comfortable course of action?

Some key things to realize:

-If you are looking for logic and for moves to "make sense", the market is the wrong place for you.
-You don't need to know what is going to happen next to prepare and manage your risk.
-The comfortable trade right now is to wait for the pullback to buy in.
-If you sell now the thinking is all you have to do is just wait for the market to hand you a gift. Easy right?

What's the hard thing to do right now? I think it is to simply stick with your trades, to continue to let them run in the face of the looming correction. The market always wants to lull us into a pattern. The pattern for the last two years has been on any breakout, SELL IT and run for the hills because a sharp decline was coming. We saw two double digit corrections between August and February. Also don't forget the September 2014 minor new high that immediately led to a 10% correction over the next 4-weeks.

These events are fresh in our minds. The market has programmed us to sell any strength, especially a breakout attempt. It has told us to just buy all dips with reckless abandon. So this is what we want to do. The market shows strength moving to new highs, but we all know how this story ends. Its going to drop hard and we can all pile in near the lows. Right...

This is exactly why trend-following works; Traders play for the reversion trade (because its worked before), but instead of reverting back to the prior range like the last 3 or 4 times, it just smokes higher. As prices rise managers get nervous because their funds are now under-performing the S&P and they have to do something to keep up. They press more risky bets to make up ground and that fuels offensive sector rotation, similar to what we have seen the past two weeks: Materials +10%, Financials +10%, XLI +11%, XLK +9%, XLY +9%, XLU +2.5%. That is a major offensive rotation, especially considering the SP500 is up +8%. The right groups are leading the advance.

To think this is just some garden variety rally within a bear market or trading range is missing the clues on display. This isn't a valuation thing, it has nothing to do with the economy or presidential elections. This is strictly a market breakout following a strongly negative sentiment period and 2-year low return environment.

And now its resuming higher. I feel strongly about this. But I'm always open to the opposite scenario occurring as well. We always have to keep that chance in perspective. Because if the market does in fact plunge we need to have a plan in place to account for that risk change. For now that key level remains the 1990-2000 support area on the S&P. If that were to fail to hold on any reversal attempt we would need to rethink the bullish thesis. For now we are in breakout mode. Regardless of whether we feel we should be pressing bets here, the price action continues to tell us the trend and momentum remain intact. It is in our best interests to follow what the action suggests. When that changes we will adjust, but for now we hold on for dear life.


Sunday, July 10, 2016

Market Breakout

The SP500 finished at its highest weekly close ever on Friday. The breakout suggests significant upside exists over the intermediate term.

SP500 Breakout (Weekly)
The move comes after a very volatile 18-month period. Whatever you choose to call the recent digestion, whether its a bear market, consolidation, bull flag, etc, it appears to be ending with this new break higher.

Its important to understand when something is changing. Last week's rally doesn't mean the market HAS to continue to move higher but the odds generally favor higher prices after a pattern completion of this magnitude.

The S&P is trading 1% above where it was prior to the UK Brexit vote. This suggests to me that the sharp selloff following the news was nothing more than a counter-trend shakeout of overly optimistic bulls and eager bears thinking the world was coming to an end. I've heard quite a bit recently that the current rally is merely a bull trap, a "sucker's rally" before we roll back over and take out the February lows. While that scenario could play out it appears to me that Brexit was more likely the trap move lower, now causing the maximum pain to the majority of traders who tried to anticipate the fallout from the vote.

SP500 5-Wave
The secular bull market remains in process. Using a simple Wave analysis it looks like Wave4 is completing and Wave5 may be getting started. Honestly when we zoom the chart out like this it looks like an incredibly clean uptrend consolidation. The modest breakout that is trying to take hold here is put into a very interesting perspective from this view point. It doesn't seem so "bubbly" or irrationally euphoric when you just slide the timeframe out a bit.

A move to the next round number 3,000 would result in a nearly 50% move higher. It seems a bit outrageous at the current time, but it is certainly within the realm of possibility, and you must be aware of the chance. If you are completely blindsided by a strong rally emerging from this consolidation you will not be ready to trade it properly. "Its a bull market, ya know?"

The risk reward based on the long-term chart here is phenomenal. If we use the pivot low from June at 1,990 we risk 40 points for unlimited upside potential. Just remember regardless of what talking heads and perma-bears say, the market can certainly go higher from here. In 1988 the SP500 had just suffered through Black Monday and used the following 15-months to consolidate that shock. The previous 5-years saw a 300% rally once the 2-year '80-'82 bear market ended. The 1988-1989 consolidation kicked off a move from 300 in 1989 to a final peak of 1,550 in March of 2000.

Basically once the SP500 competed a pattern very similar to our current environment, it went on to post the largest bull market in US history; an 11-year 500% continuation move.

I'm not saying this is going to repeat, but to think that a similar rally ABSOLUTELY CAN NEVER HAPPEN AGAIN is foolish and an arrogant mentality to have. 


On the flip-side, If we are in fact on the precipice of disaster and this really is just a dirty trick being played on the Bulls, where are the more vulnerable signals coming from?

Its always good to be aware of the counter-argument in case that thesis begins to play out.

Concern #1: Transport stocks are weak

UNP


Concern #2: Energy has seen a bear market rally and is headed back to the lows

ENERGY (XLE)

Concern #3: Global equities remain vulnerable, industrial/material companies with heavy exposure to China especially, are setup to become a further drag.


CAT

These examples above are all trading generally lower over the past year+ and are just now testing the underside of their declining 20 Month SMA's. If the market were to roll back to the downside these groups appear vulnerable to leading the way lower. 

Stocks in this position should be treated with caution for now and with a tight leash on any open exposure. They could soon find themselves in a very similar spot as Financials.

The XLF (Financials) posted a similar pattern a few months ago before heading lower.

I remain Short both BAC and C, trends remain lower for now, but it should also be noted that the XLF was one of the top performing groups leading the market higher on Friday's advance. Should the Banks stabilize it could certainly provide a strong rotation to ignite more upside.

If they remain weak (as the longer-term charts still suggest) Banks will continue to add a divergence to the potential upside resolution for the market.

Bottom Line: All we need to know right now is that a potential shift is occurring. The SP500 finished at the highest Weekly closing price in history and most stocks are back in up trends. As long as the market stays above the 1,990 swing low we have to be looking for bullish opportunities.