Saturday, February 28, 2015

Run That Winner

Let's look at AAPL. The stock has ripped, more than doubling in the last 2 years. I'm hearing lots of chatter about selling the stock here. To preface, I'm no Apple fanboy. I have an iPhone 6+ and love it, but I'm more of a PC guy. That said, I'm a trend trader and currently a shareholder.


The stock has gone up, a lot. Sure it has, but so have others and many will continue going higher. 
How greedy are we that we can't let a stock that's run over 100% have a 10 or 15% cushion to make sure its uptrend is invalidated? That method has served us well thus far, why abandon it now? Because we have a nice profit and might as well call it good?

Look, I'm a practical guy, I understand the logic. We've made a lot of money. But why sell your winning position because it's gone up? Isn't that the point. You bought it because you thought it would go up and it's started to, but you really think you can pick the top now? People try to do this constantly and it rarely works. What does work though is holding onto winning positions and eliminating losing ones. Picking tops, trying to catch every wiggle, those very rarely work.

There have been many places in the past 2-years where the top-callers have foreseen its demise. Yet all it does is move sideways for a couple months and then resumes to new highs. 

AAPL is just an example, the larger trouble is most people sell their best ideas early to "protect profits" and hold their worst ideas too long "hoping" it will come back. Selling winners and holding losers, that's a recipe for disaster. Or as legendary investor Peter Lynch has said, "that's like pulling the flowers and watering the weeds". 

This is a common trap that the overwhelming majority of traders fall into. Their accounts are too small for highly active trading and commissions from movement like this will eat up their returns. We are our own worst trading enemy. It's a repeating and self destructing cycle. 

The more effective and reasonable solution is to have a process that rewards winning ideas and eliminates losing ones.  It should stick to the single most important and often disregarded principle of successful investing:

Run your winners and keep losses small.

If you can rethink your investment strategy to reduce market movement to only what is necessary, you will stop hemorrhaging your account, and put yourself in a position to make consistent money in the market.

Follow @ZenTrends on Stocktwits and Twitter

Friday, February 27, 2015

What I Look For in the Market

*This is a post I sent out in early 2014. I feel it is a very important concept to understand. This is how I approach all opportunities in the market. I thought I'd offer an update to how the "New Base Opportunities" played out since this last post, and I have included some current ideas I'm either Long currently or are on the cusp. I hope it helps your results in 2016. 

The best advice I can give to a new trader is to look for stocks moving sideways. That might sound strange coming from a trend trader. But the key is how a stock emerges from a sideways period that will tell you everything you need to know to buy or sell. The sideways movement assures that the stock in question is not overbought or due for a correction. It shows that the current price range is an area of support and as long as the stock is above the lows of the range, the risk/reward is tipped in your favor. Almost every one of my big winning positions have come from long-term sideways bases that resolve to the upside.

Ideally these sideways trends occur at multi-year or all-time highs. This shows an unwillingness for traders and investors alike to sell the stock. They are confident in their positions and do not want to sell. This tight supply is what creates the breakout momentum as those looking to buy have to pay up to get in.

I like a base to be at least 6 months, but preferably a 1-year sideways trend gives the most upside potential. Moves from bases this size can be spectacular.

Thriving in the market doesn't come from making wild moves, but rather from managing risk and being consistent. The beauty of a sideways trading range (consolidation) is that it defines the risk perfectly. If the stock resumes from the base lower, you know something is wrong and its time to look for a better opportunity. But when it resolves to the upside, some of the best trades in the market are made.

Here are some recent examples of large base consolidations near highs:

All charts shown are Weekly Bars

HD

NKE

SBUX

BA

IP


New Base Opportunities:

TMO

Update: TMO +6.8%

UA

Update: UA +7.5%

ISBC

Update: ISBC +8.6%

FB

Update: FB +35%

*These charts were originally posted on 2/27/15 when the SP500 was trading at a weekly closing price of 2,105. I think its important to note that every single one closed the period higher from our original post date. The SP500 is currently trading at 2,056, a decline of -2.3% during that same timeframe. The takeaway isn't that we predicted which stocks would outperform the market or that the market would be poor in 2015. Rather it should be that stocks trading in a tight consolidation, especially near all-time highs tend to trade strongly when they move out of these bases to the upside. We don't have to predict the market to do well. We simply need to observe and react. A simple strategy of buying relatively strong stocks moving higher out of multi-month base formations can be an excellent way to identify great risk/reward opportunities. 

Current Opportunities (12/28/15)

LOW (Long as of 11/20/15)

TSN (Long as of 10/9/15)


PANW

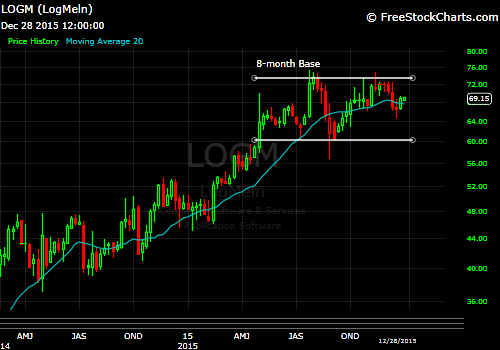
LOGM

PLKI

TSLA

With exception of LOW and TSN these other opportunities have not broken out of their current base formations. Until they do they should remain of watchlists for this particular strategy. But as we have seen before, stocks that consolidate sideways at new or multi-year highs tend to become market leaders when/if they do breakout to the upside.

They don't always work once they trigger, but you put the odds greatly in your favor with a setup like this. If they fail, your exit point is obvious and well defined. If they move in favor, one or two of these moves can make your year. Good luck out there in 2016! 

For ongoing analysis and new base formations, please follow @ZenTrends on Stocktwits and Twitter.

Saturday, February 21, 2015

Lg Cap Portfolio Update

Markets continued to move higher this week thanks to an afternoon surge on Friday. While the SP500 was mostly flat on the week (prior to Friday afternoon), many individual stocks traded very well, several of which we currently own in our portfolio. 

Focusing on trend and relative strength will keep you positioned correctly in the market. Our job as money managers and traders is to be Long the market when its is going up and protect capital when it is going down. The best way I have figured out how to accomplish this is by seeking out the strongest and smoothest trending stocks. They tend to hold up best during corrections and also lead on rallies higher, outperforming the market averages. 

Looking over our Large Cap Portfolio I would say we are succeeding at that task so far in 2015.

AEROSPACE/DEFENSE

One area of the market that has been breaking out all over the place is the Aerospace and Defense sector. We currently hold Boeing (BA) and as of the close Friday have entered a new position in Lockheed Martin (LMT). United Technologies (UTX) is currently on my watchlist going forward also.

It doesn't matter why this group is leading. I try not to get caught up in the "why" in the market, I focus on the "what". Aerospace and Defence as a group is leading this market, that's enough for me.

+Entering Lockheed Martin (LMT)
Everything I said above applies to LMT. This is a leading stock, in a leading sector, and in a strong uptrend. There is everything to like about this entry: multi-week consolidation, breakout to all-time highs, and a relatively tight stop offering a favorable risk/reward.

I only want to own this stock above the recent consolidation lows and rising 20 WMA. If LMT were to correct below this area it would suggest more digestion is needed. For our initial placement we will have our stops set at $188.35 on a weekly closing basis.


BA
Despite the market's tepid trading most of the week, shares of Boeing finished up $10. BA just continues to march higher to the disbelief of many left-out bulls watching from the sidelines. As the saying goes, "the bigger the base, the higher the move in space". The trend is definitely higher here and the recent strength suggests higher prices in the future. 

TECHNOLOGY

Pockets of the Technology sector have been working for some time. But it has been difficult to get a strong risk/reward in the better looking names. Fortunately we recently received favorable entries into AAPL and CSCO. It took awhile but the setups finally gave us the green light last week.

AAPL

A newer position for our portfolio, some will say that an uptrend similar to AAPL's has gone too far and that we've missed the move. But you can never know exactly where you are in trend. All you can do is take your signal and manage risk, that's what we've done here. Stops are at $106.

CSCO
1-yr Daily view
I wanted to look at the Daily bars here to show the action after CSCO's big gap higher. This is called trading "high and tight" and is a sign of strength.

We need to be aware of what happened in a similar situation back in May of last year. The trading was very much like our current situation. The stock traded strongly for about 1 quarter and then consolidated those gains. It then broke down in October only to surge back higher shortly after.

We may need to leave a wide stop due to a tendency to shake out traders. I said it before, CSCO is setup for a long-term run and we might need to stick with the initial breakout level as our stop longer than usual.

CONSUMER DISCRETIONARY

SBUX
Starbucks looks quite similar to BA currently. The common theme here is both digested significant gains during 2014 and have since broken above their prior highs. When a stock trades sideways near its all-time highs and then breaks through, it can create a tremendous surge. While its certainly possible that this pulls back a bit, the trend is clearly higher long-term.

Another interesting development around this space is the situation with Coffee prices. I've commented recently on social media how Coffee futures have confirmed a Double Top pattern and appear headed much lower. Lower coffee prices are great of SBUX's profits and profits help fuel stock gains.

SBUX was one of my top picks coming into 2015 and so far it has been an excellent place to be.

DIS
Keeping with the consumer theme, Disney continues to be a big winner in 2015. Again we see a multi-month sideways consolidation of a large uptrend that then resolves to the upside and is leaving many traders in the dust. Nothing to do but stick with the trend.

TWX
Time Warner hasn't exactly been the cleanest of trends recently and is currently our only position in negative territory, showing an open loss of about -2.5%. While TWX traded directly into our stop level, it also held that level perfectly and has rallied 10% in the last 3 weeks. This tells me our stop is positioned correctly and a break of that level would surely force us to look elsewhere.

While the trading has been volatile recently, I believe the stock has shaken out many of the overeager traders and sets up a good opportunity to breakout and continue higher over the long-term.

BASIC MATERIALS

I would be willing to bet that coming into 2015 a very small percentage of money managers and analysts would have picked the Materials sector to be an early market leader. I certainly wasn't thinking this way, yet here it is trading at new highs and leading the market. Not all Material names are participating, but the ones that are definitely look strong for continued upside.

PPG
With PPG holding near its highs and the trailing 20 WMA catching up to the recent swing low, we can now move up our stops to the $219.80 level. A break below that would set a new 50-day low and break the rising 20 WMA, invalidating the new breakout.

IP
There is not much to say here that I didn't say in last week's post. IP continues to be strong and I beleive it continues to move much higher.

HEALTH CARE

UNH

UNH set a new weekly closing high this week and allows us to trail our stops to $98.75. It has been a remarkable run for UNH and while a multi-month consolidation would be welcome, it continues to see immediate buy interest on any weakness whatsoever. That should tell you everything you need to know. Own strength.

BMY
BMY is still working off its recent surge and appears quite healthy above the $57.50 support level. Often the best course of action is doing nothing at all.

INDUSTRIAL

With our entry into LMT this week it does put us at 4 holdings in the broad Industrial sector. That is normally a little high for me in terms of sector concentration, but the cross section of what we hold is more diversified than the general category would suggest. We hold the two Aerospace/Defense names above as well as UNP (railroad/transportation) and HON (diversified machinery).

HON
Honeywell has had one of the quietest moves to new highs that I have seen in some time; there is hardly anyone mentioning the strength here. The stock has been routinely making new all-time closing highs since mid November while the market has been a churning mess.

I also love the support/resistance polarity in play. The $96 level was strong resistance for all of 2014, and has now become substantial support on any retest that has come into the area. Our stop at $95.88 seems solid to me.

UNP
UNP set another weekly closing high this week.  

BONDS/UTILITIES

While many continue to insist that rates will rise, I still feel there is not enough evidence to support that yet. Certainly rate sensitive names have experienced a pullback recently, but their strong uptrends are still intact for my longer timeframe.

TLT
I shared this chart on Twitter on Friday and still believe this is a counter-trend move in nature. The sharpest corrections tend occur after long-term trends reach extreme levels. These moves usually scare the newly bullish and embolden the persistent bears. But if EVERYONE is still expecting higher rates in the near future, TLT has done a great job of getting many leaning in the same direction.

There is a very solid level of interest between $126-$124. To me it appears to simply be a throwback move after setting new highs just 3-weeks ago. A break below this support range would be enough to convince me that something larger is in play here. We have held our positions in TLT since February of 2014 and I see no reason to get antsy here with such a notable level just below.

PCG
PCG isn't even close to retesting its monster breakout level at 48.50. While many have also called the end to the Utility run, PCG hasn't even given back 1/3 of its recent rally. Its so typical of short-term thinking to see a sharp shake-out move and say the uptrend is over. I fortunately don't suffer from that sort of thinking. After setting record highs just last month there is no reason to jump the gun here. Until this breakout fails I have no interest in selling my shares.

In fact I would rather be a buyer should the stock build a support base and resume higher in the near future. As long as its above the 48.50 breakout I will be looking to add to positions rather than dump my modest gains on the first sign of profit taking.


Notice that we do not have any Financial, Staples, or Energy exposure at this time. It doesn't take more than a glance as these groups to know why we don't have holdings here. While Financials and Staples don't look horrible, there just simply aren't any stocks currently leading the market higher. Until this changes we will continue to look elsewhere for potential opportunities.

Energy still remains the weakest sector and despite its recent bounce, the group is still nowhere near where it needs to be for consideration as a "market leader". We will continue to avoid this space. 

For current position updates and watchlist ideas please follow me on Twitter and Stocktwits @ZenTrends. 

Sunday, February 15, 2015

Back To All-Time Highs

Well I have done it again! I have successfully and unintentionally called the bottom for stocks. A few weeks ago I suggested that whenever I have written a "be cautious" type of post, it has coincided almost perfectly with a bottom for the market before racing back to new highs. This is why it is so important to stick with your strategy and not deviate from your plan no matter what you "think" will happen.

SP500
Weekly Trend Channel

I was listening to CNBC the other morning and heard one of my favorite traders (Josh Brown) discussing a recent trade that faked him out. He went on to say that regardless of how the stock traded in hindsight, he had to take his exit signal and was stopped out of his position. He then said how individual trade results are not what matters over the long term. The most important thing for long-term success is to stick to a consistent process. Trade results will vary depending on uncontrollable events, but if you remain consistent in your approach, you will come out a winner in the end.

It's normal to feel a certain bias toward the market, however you should only be acting on the signals from the price action of individual stocks. While I was feeling negative toward the overall market, our portfolio still had new entry signals which we took without hesitation and have now become profitable positions.

The main takeaway should be when managing money you must stick to your pre-determined plan. Do not deviate from that strategy regardless of what you might read, hear or see in the news. The price action of leading stocks will tell when to become more cautious and when to become more aggressive.

Speaking of price action of leading stocks, we had 3 new additions to our Large Cap portfolio this week. We added new positions in AAPL, UNP, and CSCO. We also increased a current holding, IP.

Entering Apple (AAPL)
1-yr Daily chart
Apple has eluded a position in our Large Cap portfolio until now. It just always seemed out of reach for one reason or another. But this week we got our signal. I actually took this entry on Tuesday's breakout to all time highs. I almost always wait for a weekly close to enter new positions for my Large Cap accounts, but this was just too good of a setup to miss.

We are in with stops below the consolidation support at $106 on a weekly closing basis. A move below 106 will not only signal breakout failure, but it will also put the recent uptrend in jeopardy. It appears the sky's the limit for this investor favorite.

Entering Union Pacific Railroad (UNP)
UNP finished Friday with its highest weekly closing price ever. After a lengthy consolidation it appears UNP is ready to resume higher. There is a chance this continues to consolidate for a while longer, but our entry signal and stops are clear.

We want to be Long this stock above the 111.90 weekly closing low. This long-time outperformer just continues to chug higher.


Entering Cisco Systems (CSCO)
This is textbook breakout material. After taking out multi-year resistance and then consolidating those gains over the last 6 months, CSCO has held and resumed its upward trajectory.

Zooming out further this picture gets even nicer:
Monthly chart
Looking back at the Monthly bars, Cisco is seeing levels not tested since 2007. The long-term MACD and Relative Strength look similar to a stock making a major bottom, not a top. This won't be a trade that is made in a few weeks, the implications are for potential multi-year returns for the Bulls.

I would be concerned with the validity of this conclusion if the stock were to turn lower and break the support lows at $26.35. But for now it appears that a date with the 2007 highs are in the not-too-distant future.


Increasing International Paper (IP)
I don't often add to existing holdings, but when I do its because of a situation like this. The stock is basically forcing me to increase my stake. Since our original entry in early November, IP had drifted sideways. I felt this was positive action as it was holding above the previous resistance level at ~$50. Sure enough we saw a great continuation breakout this week and my conviction for this stock has never been higher. -Not only did it hold its previous breakout, but it surged higher from this area validating it as new support.

We can slide our stops up to the most recent swing low at $51.50 as that would signal a failure of the recent breakout and put it back in a more choppy range.

Being that our new stop is now at 51.50, our position size can be increased to remain within the risk tolerance level, which is .5% of account equity (.5R)

At the close of the week the distance from the current price and our stop level was $5.81/per share (57.31 - 51.50 = 5.81). This meant, at the current holding size (75 shares), we are only risking .3R. And therefore can add another .2R position size (45 shares) and still be within our risk limit.

Knowing that this stock has spent the better part of two years trading sideways, in a sector beginning to lead the market and within a whisper of all-time highs, there is no reason to feel anything but raging bullishness for International Paper.

-Oh, they also pay a nearly 3% dividend yield. I'm pounding the table here!


Current Open Holdings Return (since inception 7/7/14):

UNH   +36.4%
BMY   +16.5%
SBUX  +14.6%
DIS      +12.3%
TLT     +11.9%
BA       +11.1%
PPG     +9.7%
PCG     +7.3%
IP         +4.9%
HON    +3.1%

TWX    -3.4%

SP500   +5.5%

We continue to let winning positions run and stop losers short. While we have experienced some stop outs over the last few months, we have continued to add new leading names into our portfolio. The ones that don't work we cut quickly. When they do work we give them a lot of cushion to try to become our next big winner.

Looking at our holdings' current performance I am very pleased to see such strong gains in only the first 7 months of this Funds' inception. Good things are in store for its future.

For current updates and watchlist ideas, please follow me on Stocktwits @ZenTrends.

Wednesday, February 11, 2015

Why the Russell 2000 is Not Forming a Top

Many traders and investors like to track how the more economically sensitive small cap stocks are set up to get a hint at the underlying risk appetite of the market. Usually its a good sign for stocks in general when the small cap stocks are strong and vice versa. 

Lets take a technical look at the Russell 2000 Small Cap Index to see how things look:

Weekly bars


Right away I notice the year long price consolidation after a strong rally in 2013. Price can correct large rallies in two ways, through price declining or time (sideways digestion), the most bullish case is when price just moves sideways through time. We are seeing that here.

Second, taking a look at the Relative Strength vs SP500, RUT has stopped declining as it did for all of 2014. The ratio of small caps to large caps is balancing back out. A breakout above 5.86 for this ratio would be bullish for small cap stocks Relative to large caps.

I like to use the MACD as a trend health indicator and in this case it is signalling momentum much closer to a bottom than a top. After testing the zero line and briefly falling below, the momentum has turned back positive and appears to have begun to bounce off the signal line heading higher. You can see how it looked at the end of 2013, the MACD was elevated above 40 and crossing down through the signal line. Clearly a different situation from where it is currently.

Last, looking at just the 20 Week Moving Average (price has been filtered to show general trend direction) it appears that the longer term trend is resuming to the upside. Coming into 2014 the average was very steeply trending. The year of sideways movement can be seen clearly below:
 This is how uptrends signal continuation; after a period of digestion, they resume to the upside, breaking the prior high in the uptrend. I like this view as it removes any bias that noisy price movement can cause.

It looks to me that the Russell 2000 is headed higher in the near future. That will be bullish for small cap stocks and the market overall.

*This theory would be proven false should the Index turn lower and see this trend average slope lower. 

Saturday, February 7, 2015

Watchlist 2/9/2105

Watchlist

Large Cap

2-year Weekly

UNP

BIIB

EOG

UTX

CSCO

AMZN

AAPL

Mid and Small Cap

1-year Daily

AYI

ICLR

RMCF

RHT

HURN

AMCX