Saturday, April 23, 2016

Lg-Cap Portfolio Entering Chevron, Medtronic. Exiting Short General Dynamics, Bank of America, Citi Group

While the market continues to probe its prior highs rotations continue to show more bullish activity by participants. We came into the week Short GD and a couple Financials, BAC and C. Their bid remained unimpeded and they are now back into their prior trading ranges. That was our line in the sand and now we must honor the price action. While I "feel" banks are still in trouble technically, the bullish action leaves me no choice but to move to the sidelines and see what develops. For my timeframe these are not ready for Long positions, but as Shorts they remain too risky to proceed for now. This could certainly change so we will keep an eye on the space to see how they handle "apparent" overhead supply. For now we throw in the towel.

Exit Short BAC

Exit Short C

Exit Short GD

As stated above none of these names are out of the woods in terms of overhead resistance, but for our timeframe and risk management these cannot be justified as Short holdings at the current time. All have proven the basic shift of trend that I look for which is a higher low and higher high. I don't Short uptrends.


Speaking of rotations, flows continue into Energy and the once lagging Healthcare sectors. We are entering both Chevron (CVX) and Medtronic (MDT) this week.

Enter Long CVX
I have been neutral/bearish on CVX for quite some time. It was a no-touch as it began its implosion in late 2014 and then was trapped under substantial supply for the better part of the last year. Recently however the stock has been acting well as it was not rejected at the 95-100 level like it was in November of '15.

The past 5 weeks the stock entered its resistance band and consolidated tightly. This showed a lack of sellers and that buyers were gaining control. This week we saw a significant surge through this key inflection level. I have stated many times in the past 10 months that I wanted nothing to do with CVX below $100. This week it convincingly broke through the psychological barrier and the action has turned decidedly bullish.

One thing to always remember, its not really important what you think should happen. I thought CVX was in big trouble as long as it held below $95. But when the market proves your theory wrong and price does the opposite of what you expect, the moves that come can be strong.

The setup here is simple: as long as Chevron remains above the prior resistance level and recent swing low at $92.25 we want to be Long this name. They will report earnings this week so some added volatility will be present, but our risk is clearly defined and the trend is now in our favor.

Enter Long MDT
Medtronic has been on my watchlist since the October rally. It was testing its all-time highs and looked poised to breakout. But after the sharp rally from the September low a rest period was needed.

The stock has now closed at a new weekly closing high and has done so after a tight 4-month sideways digestion. The launch pad is now in place to send MDT higher and we have a clean entry signal.

Stops will be placed below the recent pivot low at $73.40 which would suggest a failed breakout and trend invalidation should it breakdown from there.

Our Lg-Cap Portfolio is now 55% Long: GE FB AEP PCG PM UNH SHW PEP MSFT CVX MDT
and 45% Cash

Utilities got smacked this week but trends remain in place long-term


AEP


PCG


Rates and rate sensitive names got freaky this week, likely due to the pending Fed decision on interest rates next week. The Federal Reserve will announce their rate policy for April this coming Wednesday so expect some volatility around the event. Its widely expected that there will be no change which would seem to be bullish for Utilities, Bonds, and other high yielding assets. Keep that announcement on your radar and lets see how the market responds to any policy deviation. 

Thanks for reading
-ZT

Saturday, April 16, 2016

Financials: Short-Term Momentum vs. Long-Term Resistance

Financials came into the week as the worst performing sector in the market. As Followers to this blog know I came into the week bearish and had opened a couple Short positions in the XLF's top laggards AXP and C.

As we now know that didn't work out so well; the plodding AXP rallied 5%, while C ripped 11%. Fortunately I use options when I trade Short and the damage to my capital was well contained. Bear in mind the percent moves are higher in options but my overall risk was quite low. 

Both C and AXP traded above our initial stops yet I feel some perspective is needed in determining our future positioning. My Put option positions are capped at a maximum .5% capital risk; in the event of a total failure, downside risk is limited to .5% of our portfolio. This allows us some leeway after having more information than we did prior to last week. 

AXP WeeklyAXP was one member of the XLF that did not report earnings this week. They will report this coming week which leaves additional risk in play. Due to that added earnings risk and the fact that it did close above our stop level, we closed our AXP Short. 

C Weekly

C reported earnings Friday morning and despite an early surge, shares were sold into major resistance and finished lower on the day.

C Daily

 Because of where the sellers stepped in and due to the "sell the news" type reaction, I feel it's most prudent to continue to hold our Put position and use Friday's high as our new exit point. Again our maximum loss for the trade is capped at .5% so we are not taking excessive risk by remaining short here. 

BAC Weekly

BAC also reported earnings this week and it too was met with sellers at its key resistance level. 

We have been watching BAC and waiting patiently for a retest opportunity of the range breakdown near $15. With this week's surge in the Financials we got that retest. Now that earnings are behind us we can comfortably trade it Short using this week's reaction high as a reference point. 

Should we see BAC resume higher through this week's high and return to its prior trading range it will be no problem admitting we are wrong and stepping aside. 

The move in the Financials this week was notable. Whether that move was genuine "risk on" rotation or the final purge of stubborn short sellers I don't know. What I do know is the long-term trend remains lower for the group. With the SP500 moving into its 18-month resistance zone coinciding with many major Financial stocks moving back into overhead supply, I still feel the risk/reward favors the short side for the time being.

Sunday, April 10, 2016

Neutral Posture, Financials Entering Wave5 Continuation

We've come to a place where I think its best to be more neutral toward the market. The picture is pretty clear moving forward. The SP500 is now bumping off its downtrend resistance line and is back into substantial overhead resistance. I'm not saying the market can't continue higher from here, but it will have to move above 2,075 if it intends on making higher highs. That's our line going forward. As long as the SP500 Cash remains below 2,075 I don't see a reason to be overly bullish.

SP500 Daily
 Here is what I see at the current moment. Price came right into the multi-month downtrend line drawn from the July, November, and December highs. This has occurred after a 14% rally in about 7-weeks. There are two unfilled gaps remaining above acting as resistance, as well as a lot of trading activity from the November-December consolidation. There are 4 open gaps below current levels that will likely be trade-to targets in the future.

The price action is now becoming more heavy and volatile. During the recent uptrend volatility was very low, but since the "Yellen gap" on 3/30 the movement has been erratic and choppy.

SP500 30 minute 
It appears the last week has at least slowed the uptrend since the mid-Feb breakout. The tendency has been to snap back quickly from any sort of weakness, so keep an eye out for another bear trap scenario. The two levels you should be most concerned with are the high from April 1st at 2,075 and then Thursday's swing low at 2,035.

The most troubling activity I noticed for the bull case was how Friday played out. Following Thursday's big rejection of Wednesday's rally, Friday saw another strong early morning trade. However by mid-day sellers stepped in and took back much of gains for the day leaving a weak setup heading into next week.

With the relentless rally we have seen, there is nothing wrong with some consolidation or pullback. That being said it appears the risk is to the downside from here, especially with the market below its  downtrend resistance. I'm still holding Long positions but also think having a solid Cash reserve and possibly a couple Short positions is a prudent posture currently.

Our Lg-Cap Portfolio is 55% invested with 9 Long positions, 3 Short positions, and 50% Cash.

Long: GE, FB, AEP, PCG, PM, UNH, SHW, MSFT, PEP
Short: GD, and entering AXP, C

Entering Short American Express (AXP)
 If you recall we closed out our successful AXP Short position back in mid-January as our options were due to expire and the stock had declined over 25% in a little over 4-months.

Over the last 8-weeks AXP has rallied more than 20%. It is now back to the declining 20 WMA and prior resistance from 2012-2013. Volume also shows sellers remain in control; big volume on declines and lower volume on rallies.

The Financials remain the weakest sector in the market and AXP appears to be the weakest stock within the group. The risk/reward is also very appealing as we can place our stops at the recent swing high at $61.66 on a weekly closing basis. This means we are only risking $2/share to continue to ride this trend lower. With the market in a precarious position, adding the weakest name in the weakest sector to our Portfolio makes a lot of sense.

Entering Short C
 Citi now appears to be rolling over after its oversold bounce. With the 3-year trading range resolving to the downside, this is very typical trading action. Often the trend will begin to shift prior to breaking support (as we saw from July 2015 to the first week of January 2016). Following the trend change a big flush below support tends to occur. This is followed by a bounce attempt where bottom pickers and mean-reversion traders step in for a pop. As the stock approaches prior support, trapped buyers from the range begin to sell to "get even" and new momentum traders (us) sell the stock short as the downtrend is set to resume lower.

This is another setup with a strong risk/reward. We can set our stops against the weekly swing high near $43.50. A close above the high would be enough to suggest either more consolidation is needed or the stock has in fact bottomed and wants to resume higher.

Financials Entering a Wave5 Trend Continuation

A large part of my thesis for being short the Financials here is the view that the group is beginning is Wave5 decline.

XLF

C

BAC

GS

I'm not a big Elliot Wave enthusiast because its a highly subjective form of analysis. But I do recognize that markets move in cycles based on sentiment and trend. When a pattern is this clear, Wave Theory tends to be quite accurate.

We have seen a substantial rally in the broad markets over the past 6+ weeks, during this time the Financial sector has been able to resolve its oversold condition and is now (along with the broad market) running into strong overhead supply levels.

Trends often persist longer than seems reasonable. When a support violation occurs like we have seen in the major banks it tends to take a long time to resolve that downtrend pressure. All the major banks are now trading below 2 years or more of support and we are seeing lower lows/lower highs within the intermediate trend. This combination is the worst possible scenario for hopeful bulls. I believe the next leg lower is imminent and could be quite violent as 5th Wave continuations tend to be.

If we are wrong and the banks somehow turn higher, we will simply stop out quickly and let the market prove the next direction.


High Praise for SHW
 If I am going to remain aggressively Long a stock in this environment, one behaving like SHW is what I'm looking for. While the market recorded its first down week since the February lows, SHW broke to new all-time highs. I posted on Stocktwits early in the week to watch for a move higher on the short-term charts. We saw the breakout occur on Wednesday and I took an aggressive position against the short-term trend support near 285.50.

With this move to new highs we can trail our stops to the "acquisition day" swing low near $270. After a brief shakeout following the announcement of Sherwin acquiring Valspar, the stock has not looked back.


Bottom Line: It appears the market could be due for a rest after its torrid run over the past two months. There is now some evidence mounting that a pullback or sideways digestion could be about to take place. Financials began a rollover on their recent oversold bounce and appear to be headed for lower prices. When Financials lag it tends to put a lot of pressure on the overall market, so keep this in mind.

As long as the SP500 remains below the 2,075 swing high, a more neutral posture is warranted. Should it rally back through that high I would think there is a good chance we see a move above the prior all-time highs from last summer. This though I feel is the low probability scenario. That doesn't mean it can't happen, but I would protect myself a bit in the meantime.

As always continue to seek out the strongest stocks leading the market and avoid those that are showing weakness and lagging. If we do in fact get a pullback in the broad averages the stronger stocks will hold up better and the weaker names will get crushed. Sticking to relative strength and selling relative weakness will help your portfolio weather the market's storms.

Thanks for reading
-ZT


Sunday, April 3, 2016

Q1 in the Books

The month of March is now behind us and with that the close of the 1st Quarter. As most know January began with a swift plunge down -11% in the SP500. That was followed by a +13% rip to bring us back to even at the end of the Quarter. While the market has gone effectively nowhere in 2016, it hasn't been without its drama and opportunity. In fact the corrective period has set up many very strong Monthly charts.

Last week we wanted to watch how the market handled another test of its 20 Month SMA. Alas it finished in an impressive manner and is now firmly back above this long-term average price.

SP500 Monthly
It is my general thesis that when the SP500 is above its 20 Month MA good things tend to happen. Conversely when the market is below this line bad things tend to happen. This isn't a perfect strategy, but it more often than not keeps you on the correct side of the trend.


With the close of the 1st Quarter I thought it would be a good idea to review some of the best looking long-term charts in the market. Let's look at each of the 9 major Sector ETF's top chart (my opinion) in each group.

Top monthly charts in the 9 major XL sectors:

XLP- KO
Note this chart shows without dividends calculated into price.

Regardless of dividends included or not, this stock is making a monster breakout above its prior all-time highs from the late 90's. KO has built what appears to be a rounded base/Cup-Handle formation. I do own this stock and continue to build a long-term position.

In sympathy to this move in KO, PEP is making a solid breakout of its own and we added it to our Lg-Cap Portfolio this week.

Entering PEP
KO and PEP trade mostly the same. What is good for one is good for the other. PEP has formed a solid base over the past 18-months and is now resuming to the upside. We are giving this a little more room than we may need to, but that is due to the monthly chart and the location of the rising 20 Month MA. This average has been strong support for the stock during its rallies in the past.

XLK- MSFT
Our other new entry this week also boasts a strong long-term chart. After consolidating its rally from 2013 the stock has continued to press higher.

The Weekly view shows a very clear retest of the prior breakout and now follow-through above the January swing high. We will put our stops below $50.

XLU- AEP
 AEP has a massive base breakout in motion. The stock retested these prior, multi-decade highs and has since resumed to new highs.

XLV- UNH
Every time UNH has pulled back since the '09 lows it has found support at the 20 Month MA. Will this time be any different? I don't know, but I don't have to guess. Just stick with it until it fails.

XLI- HON
Honeywell has a robust breakout in motion following a year-long consolidation. Why are we not in this name here? I don't have a super answer for that, other than previous breakout attempts have failed and the market is stretched...? I know, not a great answer.

I guess what I would want to see would be for this breakout to hold and show follow-through. Like the MSFT example, we didn't get in on that initial breakout either. We just bought some time and let it prove itself. That's what I want to do here as well.
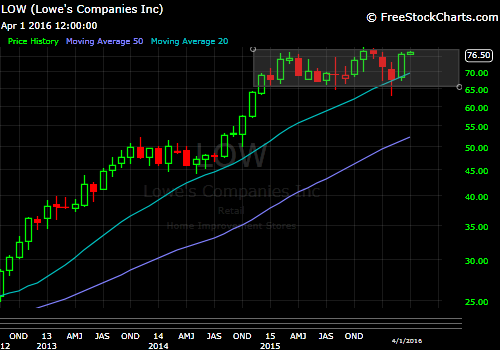

XLY- LOW
Lowe's was my favorite chart heading into 2016. After a strong breakout-reversal, the stock has held its ground and is now pressing higher. Should this return to new highs it would qualify an important "Turtle" rule: that an entry is only taken if the prior trade signal failed. Meaning if the most recent breakout signal failed but then held its support and resumed higher once again, the subsequent move had more significance than the first.

The theory being:
1. Initial breakout buyers get stopped out on the failed move
2. Those same buyers sell but the stock doesn't continue to decline.
3. New buyers establish positions with the shares purchased from bulls who were shaken out.
4. The real breakout occurs and continues as so many disgruntled traders refuse to give in and buy the stock back at higher prices.
5. Reluctantly over time those buyers are dragged back in which leads to the stability of the new trend.

The hardest thing to do in the market is buy back into a stock you were just stopped out of. You simply don't want to be proven THAT wrong. First you were wrong when the signal failed to lead to profits, then you were wrong for thinking it would go lower following your exit. Next you don't want to admit (even though your initial thesis is now being proven correct) that you should chase at these higher prices.

The psychology can be fascinating. Now that I think about it this sounds a lot like my HON justification above. We were stopped out of HON after a marginal profit and it has now turned back higher without me. I justify sitting on the sidelines because of any number of reasons. You see where this goes...

If LOW breaks out soon I would consider that a powerful signal.

XLF- SPG
SPG is by far the most constructive looking Financial in the XLF here. The Monthly view shows it closing at new highs. This is one I'm watching closely as the REIT stocks are red hot.

XLB- SHW
SHW shows an incredible trend. It loves to flag and rally. Similar to UNH above, just keep running while its there.
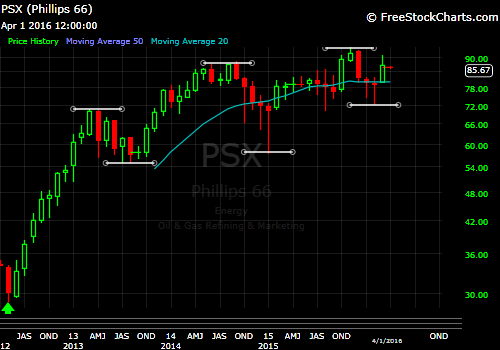
XLE- PSX
Considering the total mess that is Energy, PSX continues to trend higher following the spin-off in 2012. If the group could really find its true low this would be a great spot to look for an opportunity.


The clear leading groups are now Staples, Utilities and Technology. With the additions of MSFT and PEP our portfolio is largely positioned toward that strength.

Heading into the 2nd Quarter our Lg-Cap Portfolio is now 50% invested and 50% Cash. We remain Long FB, GE, AEP, PCG, PM, SHW, UNH, MSFT, PEP. Short GD. 

Due to the length of correction many charts are setting up substantial bases. How these bases break will be our road map going forward. There are many names that remain constructive and a resolution higher would present a strong buying opportunity. While others appear vulnerable to a downside resolution and would be good short candidates. 

With the recent volatility we've seen in the markets over the past year you should be in no hurry to act in either direction. We continue to have large swings, and for all but the most nimble, being patient remains a fine strategy. Yes you will miss out on some of the action, but we aren't here for action. We are here to grow our accounts by identifying strong risk/reward setups and managing risk over time.