Last week we wanted to watch how the market handled another test of its 20 Month SMA. Alas it finished in an impressive manner and is now firmly back above this long-term average price.
SP500 Monthly

With the close of the 1st Quarter I thought it would be a good idea to review some of the best looking long-term charts in the market. Let's look at each of the 9 major Sector ETF's top chart (my opinion) in each group.
Top monthly charts in the 9 major XL sectors:
XLP- KO

Regardless of dividends included or not, this stock is making a monster breakout above its prior all-time highs from the late 90's. KO has built what appears to be a rounded base/Cup-Handle formation. I do own this stock and continue to build a long-term position.
In sympathy to this move in KO, PEP is making a solid breakout of its own and we added it to our Lg-Cap Portfolio this week.
Entering PEP

XLK- MSFT


XLU- AEP

XLV- UNH

XLI- HON

I guess what I would want to see would be for this breakout to hold and show follow-through. Like the MSFT example, we didn't get in on that initial breakout either. We just bought some time and let it prove itself. That's what I want to do here as well.
XLY- LOW
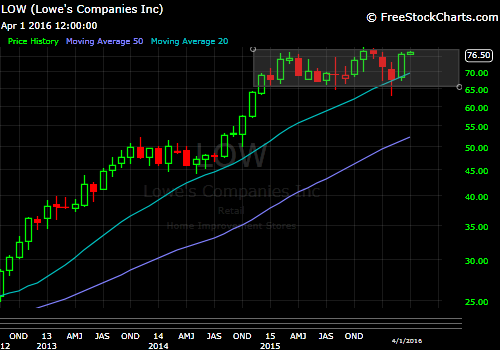
The theory being:
1. Initial breakout buyers get stopped out on the failed move
2. Those same buyers sell but the stock doesn't continue to decline.
3. New buyers establish positions with the shares purchased from bulls who were shaken out.
4. The real breakout occurs and continues as so many disgruntled traders refuse to give in and buy the stock back at higher prices.
5. Reluctantly over time those buyers are dragged back in which leads to the stability of the new trend.
The hardest thing to do in the market is buy back into a stock you were just stopped out of. You simply don't want to be proven THAT wrong. First you were wrong when the signal failed to lead to profits, then you were wrong for thinking it would go lower following your exit. Next you don't want to admit (even though your initial thesis is now being proven correct) that you should chase at these higher prices.
The psychology can be fascinating. Now that I think about it this sounds a lot like my HON justification above. We were stopped out of HON after a marginal profit and it has now turned back higher without me. I justify sitting on the sidelines because of any number of reasons. You see where this goes...
If LOW breaks out soon I would consider that a powerful signal.
XLF- SPG

XLB- SHW

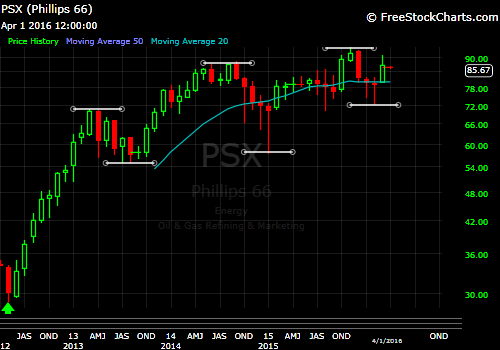
XLE- PSX
The clear leading groups are now Staples, Utilities and Technology. With the additions of MSFT and PEP our portfolio is largely positioned toward that strength.
Heading into the 2nd Quarter our Lg-Cap Portfolio is now 50% invested and 50% Cash. We remain Long FB, GE, AEP, PCG, PM, SHW, UNH, MSFT, PEP. Short GD.
Due to the length of correction many charts are setting up substantial bases. How these bases break will be our road map going forward. There are many names that remain constructive and a resolution higher would present a strong buying opportunity. While others appear vulnerable to a downside resolution and would be good short candidates.
With the recent volatility we've seen in the markets over the past year you should be in no hurry to act in either direction. We continue to have large swings, and for all but the most nimble, being patient remains a fine strategy. Yes you will miss out on some of the action, but we aren't here for action. We are here to grow our accounts by identifying strong risk/reward setups and managing risk over time.
No comments:
Post a Comment