Monday, October 28, 2013

Entering XLP (Consumer Staples)

While the market has continued to grind higher over the past few months, the Staples sector has been chopping and creating a tightening price action. We have been seeing them test the upper consolidation range recently and this morning the group has broken significantly to the upside.

XLP has the look of a continuation "flag" type pattern in play here, with significant upside potential from here. Many of the biggest names in the sector have been churning and working off the big early gains they saw this year. This setup today suggests they may be ready to continue that upward trajectory.

As always we will be cognizant of the downside risks as well. Initially I am looking at a breakout failure around the $39.50 level. It is possible that an invalidation could occur before that point, but we will just have to see how that develops going forward. But as of now we will use that prior low as our stop.   

Daily Chart

Weekly Chart
Our signals have lined up on both time frames; We are seeing a breakout above the prior highs, upturning 20 WMA, and RS breakout from a 6 month downtrend. This looks pretty textbook here and as always we will take our signal and worry about the results later.


Something interesting of note about the Staples and we have touched on this before, they tend to outperform while the market struggles or consolidates. In fact I have seen a few of the more defensive groups gain a little steam over the past couple weeks and considering that the market has moved quickly higher recently, these signals could be seen as a sign of weakness to come. Now, that doesn't mean the rally is over or anything, but it does show that money managers are wanting to put money to work somewhere and are feeling that some of the more extended offensive groups are too expensive up here. Therefore they are aiming to the more risk adverse names that pay healthy dividends, but still wanting to participate in market upside.

Saturday, October 26, 2013

Weekend Update: Open Position Review

Markets were rather subdued this week but the S&P did manage to set a new closing high. While gains in the major averages were modest, we saw some strong performance from several of our holdings. Lets take a look!


AAPL
AAPL had a good week, breaking out decisively from its resistance area. Two weeks ago I said that on the shorter term timeframe more upside was expected and since that call, AAPL is up nearly 8%. The most impressive thing about its rally is that it occurred at a very big sticking point for price recently. I love to see the short and long term timeframes line up; here the long term signaled our initial entry, the short term told us that we would likely see the resistance broken and now again the longer term signal was generated from the breakout. Awesome stuff from a price perspective!

 AAPL will announce earnings Monday after the close, so be prepared for a volatile day. But as of now price suggests the trend should continue.

CMI
While CMI didn't do much this week (in fact it lagged a bit), you can see how price has behaved since making new all-time highs. Since the breakout, price has consolidated the big move very orderly and is currently bouncing back signifying a continuation. As long as price can hold above this breakout zone for a little longer, we can move our stops to just below the prior high and new low at $128.

F
Ford announced earnings this past week and after an initial pop on the news, it traded lower to flat into the end of the week. This is not the best action off of news of another strong quarter. Usually when good news is not bought strongly, it says that price has reached an intermediate term top (think HD as a recent example). We are at a sticking point here (and really have been since that Double Bottom target acquisition back in June). Price is currently in the resistance band for the massive Head/Shoulder Bottom pattern and we will need to see a stronger push to the upside to believe that a significant rally can occur from here.

Stay with Ford, but stay lightly positioned until either price corrects back to the lower supports or breaks out above $19. In the markets there are times to press trades and times to put on the brakes; after a nearly 100% move in F since mid 2012, I feel the time to put on the brakes is here. 

PBW
PBW got sold this week after a 2 month straight up rally. I have stated that I would like to see this move sideways and consolidate for several weeks before heading higher, as that would set up a nice new support base. I am VERY pleased with this above $6.40, but wouldn't be stunned if it traded back to the 20 WMA at some point in the next month. The $6.00 level will be an important one to watch.

DDD
DDD continues to defy gravity and other than a violent shakeout move 3 weeks ago, this has maintained its place along the upper Bollinger Band; when price stays so close to the upper band it shows great strength. While I have taken some short term gains off since buying that dip a few weeks ago, this still seems poised to continue higher. The long term cup/handle pattern is seeing follow though now and looks to be a valid pattern (meaning the market is acknowledging the bullish formation).

This will continue to see violent moves up and down. My plan with this is to put money to work on the big dips into support and trim off as it moves back into the upper range. I do maintain a long term positioning at all times as well, but this is a fantastic stock to trade a bit, it you are inclined to do so.

PPG
PPG just keeps rocking higher. After reporting a great quarter this past week the stock has ripped through the upper channel resistance. This usually means one of two things: either it is over-extended and will correct back to the longer term trend OR it is about to undergo a parabolic type move that will then go on to be an intermediate to long-term top.

Those are my "speculations" based on the theoretical idea of trend and channel resistance, but as always we will stick with this long term winner until we have proof that the move is in fact over...As of right now it is simply in "beast mode" and should be held as a fantastic anchor position in a portfolio.

HAIN
HAIN has been another big winner both this year and the past 3 weeks. This (like DDD) I have also reduced into the strength we saw this week in my shorter term accounts. Again if you were in there buying that retest of the breakout 3 weeks ago, we have seen a 15% move off those lows, and some of those quick gains can be taken here. Especially considering that Earnings will be announced on Nov 9th, I would be looking to trim shorter term trades from now into that Nov 9 date. Long-term this still looks great and I am holding for longer term accounts.

The "Close Watch" Sectors from last week:

XLI (Daily view)
Well it didn't take long for the Industrials to breakout to new highs! Last week we were watching to see how the short term under performance was handled by the market at all-time highs. Our RS trend saw a great bounce off support, signaling that the strength is still in place and that XLI was just taking a breather after a good run up.

This is why we map strength and trends, they let us know the intentions of prices before, during and after an event or test. The mapping provides us with an edge over random investing, and is the reason we will improve our returns over time. 

XLB (Daily view)
I could basically say ditto for the Materials sector, also breaking to new highs. Now that Materials are showing solid leadership, you should be exposing yourself to the space in some way if you have not done already. I'm seeing a ton of value and great setups in some of the mining stocks...My top mining picks here are FCX and NUE (I am currently long both names and have been for about a month).
 They are showing great relative strength and price breakouts, have been beaten up over the past few years and are now seeing money rotate back into them.  


That's all for this week. With the markets at new highs after the recent big bounce, it would be healthy for some consolidation before pushing too much higher. I want to see signs of a stable trend and new high, that will provide longevity to the rally. A big spike here could be dangerous to the market longer term, so I will also be on the lookout for any "blow off" type move.

As of now its still "all systems go". We have new-all time highs, solid offensive sector rotation, and plenty of Fed stimulus into year end. Keep riding the wave!

Sunday, October 20, 2013

Weekend Update: Kick'n the Can

DC politicians did what they do best this past week; after much hemming and hawing, Congress was able to reach a temporary solution to mitigate the rapidly approaching default limit. They just love to bicker and squabble right up to the last minute and then finally say, "well lets worry about this a little later". Neither side really gets what they want (especially the Republicans), but they appease each other for another 4 months, so they can do it all over again. We have seen this time and again, its why its so important to stick to unbiased price action and not to sensationalized media headlines. Price creates an edge in assessing the markets, news headlines do not.

After all the hullabaloo over the past month or so, Congress has extended the debt default date to February 7th and has reopened government services. Chalk up another win for Obama and the Dems. The Republicans and the Tea Party are caving in on themselves and continuing to chase the rational part of the American public over to the more moderate, Democrat side. Contrary to what financial media and Big Business likes to project, US stock markets historically perform better (on average) when a Democrat is in the White House. From my vantage point, the Republicans have NO CHANCE of taking the reins in the near future. While I don't like to discuss politics, in this case its interesting to look at historical market returns under each regime:

   The most impressive stat on this chart is the S&P returns under Clinton/Obama vs the most recent George Bush. From 1993 to present when Clinton/Obama maintained the White House, US markets are up 32.2% while from 2001-2008 under W. markets only averaged a 3.3% return. I'm not trying to show you bias or political opinion, I'm simply trying to show the facts. Going forward I highly expect Democrats to remain in power at least through the next term following Obama and that should bode well for stock returns.
Another very notable and surprising stat is that every presidential cycle grouping had a positive return except 1913-20 which was the time leading into the Great Depression. Interesting!
 One last observation from this chart, take a look at the Earnings Per Share(EPS) change in 2009-2012...Earnings for S&P500 companies are up 51% since the recession. That is a very nice economic recovery. Remember when companies make more money (increase EPS), their stock prices go up. If companies are making more money, the market is going higher.

The other most notable development that happened this week was ANOTHER NEW ALL-TIME HIGH for the S&P! While it would seem that stocks have gone up too much, or there are momentum divergences present, markets continue to shrug off negatives and press higher. A particularly bullish scenario has emerged from the government shutdown and debt issues. The shutdown has cost more money than expected and will likely hinder GDP growth for the 4th quarter. While that sounds bad for the economy, remember that the economy and stock market are not linked directly, and these economic strains are significant enough to warrant no change in Federal Reserve easy money policy. On top of that Obama has recently appointed Janet Yellen to be the next Fed Chairman following Ben Bernanke and she is known to favor his very aggressive stimulus policy. Part of the reason I believe the Democrats will maintain control of the White House for the foreseeable future is directly linked to Federal Reserve policy. A major presidential issue from the most recent elections was economic stability and one area the President of the United States has ultimate control is on appointing the Federal Reserve Chairman. If you don't think the fox in guarding the hen house, then you simply are not paying attention. Obama has made it abundantly clear that he wants a stabilized economy and higher stock market. His (forced) suggested resignation of Larry Summers (this is my own conspiracy theory, Obama has never been anywhere near publicly suggesting Summers withdraw from the chairmanship race) and his backing of Yellen shows that he wants to do everything he can to prop up the US economy and will go to lengths to show that He and the Dems are responsible for the economic stabilization post 2008. Economic recovery, being such a tipping point issue, is one thing Obama will not let slip through his fingers and has ultimate control over money printing and stimulus activity. It is my belief that the economic recovery will be enough to push the next Democratic candidate over the top in the next election (likely Hillary Clinton...Bill back in the White House? remember those S&P returns from 1993-2000? Could be an interesting scenario). Thats my two cents, but what do I know?

Getting back to those new highs! Lets look at some Sector charts to get a good perspective on where we sit currently:
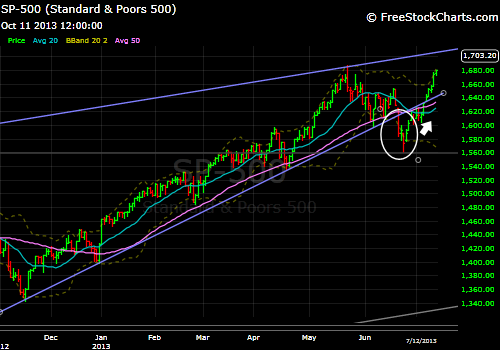
SP500 daily chart
Just like AAPL last week, we talked about the change of direction of the 20 DMA. When it turns from down/flat to up it signals a fairly successful edge in expected gains for the near term. What is interesting about this move to new highs and the just now upturning 20 DMA is that they are both occurring right at the upper wedge resistance which has been a sticking point recently. While it is somewhat concerning to be right up against the upper range, it is also very interesting to me that my signals suggest buying the new high rather than selling here. My emotions and rationality says that I should be taking profits here and reducing risk, yet my signals keep popping up with new buys, not sells. It is always pleasing to me when my plan signals a buy when it doesn't seem right or comfortable to do so. But this is why we have a plan and set rules in place; to help us navigate risk/reward objectively and not let emotions dictate our decisions. It has been shown throughout time that emotions are the main reasons for losses in the market and strict systems based on technical signals have shown to outperform the "seat of your pants" strategy consistently. This setup will be interesting to watch going forward.

First the Sector groups that we are currently holding:
-Daily Charts to show breakout days

XLY
 We keep saying the same thing about Discretionary, it looks strong and is a major market leader. The recent consolidation has allowed it to cool off relative to the overall market, but is now bouncing off long term trend support while price is breaking out to new highs...This is good action!

XLK
 Talk about a breakout! Tech has really struggled all year, it has just started to show some life over the past couple months, although the last 6 weeks have been fairly meh for the group overall. Except for this week and Friday especially. VZ announced a strong quarter early in the week, AAPL is turning around and GOOG reported a blow out quarter Thursday after the close. GOOG finished the trading day Friday up $122 per share! I like tech here.
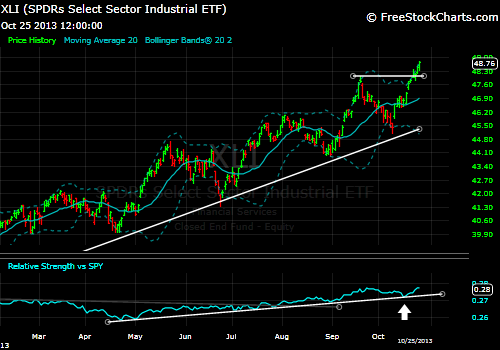
XLI
 Industrials have been a leading sector for much of the summer and helped stabilize the market through the dregs of the year. The last pullback was not too kind to the relative strength of XLI, but it is now coming right off its uptrend support and I hope to see a breakout to fresh highs soon. Pay attention to how this reacts near these levels, we would hope this short term lagging will be resolved soon. 

XLB
 The same can be said about Materials. While they have not made a new high yet, the recent correction simply came back to kiss the prior breakout level. It now seems headed back through the prior highs. This, just like XLI, will be important to watch to make sure they follow through above the highs.

XLE
Energy has turned into a monster all of a sudden. This was a huge move this past week and there is nothing to not like in this space going forward. It looks like full speed ahead!

XLV
Healthcare continues to lead and impress. XLV followed suit and broke through to new highs this week. Interesting to see so many shakeout moves before this last rally; many sectors did the same thing. But it just shows what this market is all about...Leaving people behind so they are forced to play catchup, therefore pushing the market higher. Nervous bulls get shaken out, then prices turn and rip. Awesome to see if you're on the correct side of it.

Sector groups on watch list, not currently held:

XLF
Speaking of nervous bulls, we were part of the Financial shakeout. We were squeezed out of our position only to look foolish now as XLF was the best performing group last week. That being said, we followed our plan for trend health and moved aside; the plan doesn't always work, that would be too easy. We are very close to receiving a new entry signal here should price follow through above the prior highs at $20.93. That will show that Financials are ready to resume higher. That signal will likely come early this week unless the move turns out to be false. Either way we will know soon.

XLP
Staples have been trapped in this triangle formation for months now and haven't shown any sort of strength relative to the SP500. First we would need to see a breakout above the prior high near $42, and then would need the RS trend to begin to outperform. XLP is not there yet.

XLU
Utilities present an interesting "value" opportunity here for long term investors, but based on relative strength there is still plenty of work to do. I do like the attempt to break out of this big triangle pattern, but that has not been confirmed either. Its still wait an see with XLU

Important "Risk Off" (Fear) Indicators:

TLT treasury bonds
Treasury bonds are still lagging long term and are not a buy right here, which suggests that the market rally is not over yet. However, on a short term basis, they seem to be putting in a bit of a consolidation. This would still need to break above the range highs around $108, but nothing can be seriously considered strong until the $110 level is retaken.

GLD gold
Gold and its sloppy reversal attempt are on thin ice.Relative Strength has stabilized from the free fall recently but price is sure taking its time to turn around. Nothing to be done here yet; no panic in the market.

US$ dollar
While many shorter term traders and media pundits have been talking about buying the Dollar, I have been against this for some time now. It has been a weak relative performer and seems to be breaking down from a very solid trend support. Remember that a weak Dollar is typically good for stocks and Gold, so it will be interesting to see how this breakdown turns out. A strong Dollar is also an indication of protection seeking and macro nervousness, right now we are seeing none of that.

The Most Bullish Chart of the Year...

Russell 2000 small caps
Which brings us to the most bullish chart for the market. When small cap stocks outperform, all boats are lifted and it shows strong risk appetite by investors. The Russell 2000 has been very strong this year and I see no end in sight. We will use this as a primary market health indicator going forward as it will usually hint at a problem before the larger/safer stocks will. When trouble comes investors will dump the highest risk positions and take profits on their biggest winners. The Russell will be one of the first to show this type of change.


That's it for this week All. Next week I will run through all our stock positions and talk about how those look post breakout.

Saturday, October 19, 2013

Adding to Clean Energy (PBW)

Well that was a quick move, so much for significant overhead resistance! However this is exactly the kind of action you love to see if you are bullish a stock or sector. We take some prudent risk management considerations and the stock just rips right in our face.

There are a few important lessons we can discuss with this trade evolution:

1. Regardless of what a stock does or should do based on our perceptions, we can't dwell on the fact that we were wrong and missed out on a little extra profits. We had our target acquisition and significant supply levels based on the historical price action. That's just reasonable risk assessment and management. As I have stated before "it's ok to be wrong, but it's NOT ok to stay wrong".

2. When the market proves us wrong we must adapt our thinking and not "dig in" with our beliefs until they are proven right. The market is ALWAYS correct, we are not. When we get such a strong signal from the market (stiff overhead resistance that the market doesn't even bat an eye at) you must respect that price action and align yourself with it.

3. You NEVER sell an entire position that is in a winning uptrend. When you have a winning position but you observe a strong sticking point ahead, at most you reduce the position by half. We cannot ever be 100% sure of a future outcome and trends can persist much longer than seems reasonable and rational. By only selling half the position we are still situated where we can further profit from increased price appreciation but are also covered against the most likely probability of a correction in price.

4. When a stock just slices through a very significant price/emotional level that is a VERY strong signal and the trend should continue.

With these new developments in mind, I added back to the position Friday and intend to hold aggressively above the $6.50ish breakout level. This prior resistance should become support on any future retests. This will be a key inflection point moving forward and a great place to set trailing stops .

We have now seen two consecutive weekly closes above $6.50 with this weeks' action, providing the breakout and buy signal. This has run 7 positive weeks in a row so some constructive consolidation between $7 and $6.50 would be a very welcome sign for trend health in the future.

You have to be willing to be flexible and unbiased as a trader/investor, when "plan A" fails you need to be ready quickly to flip to "plan B". You need to be able to get right back into a position if your initial idea is quickly proven wrong. There is no place for your ego in trading, the market will humble you every time. You need to be resilient and open-minded, if you are you will do fine managing your own investments.

Saturday, October 12, 2013

A Market That Wants Higher Prices

   I have been sensing something happening for some time now. In the "new age" of Fed stimulus efforts, markets are simply not allowed, as it were, to breakdown from significant technical levels. There is a never ending bid for stocks (this will end at some point and that is when the tide will significantly turn) and that is creating complacency with investors/traders. What this market is doing is conditioning participants to believe that "stocks always come back, just hang in there a little longer". This is the kind of action that crashes are built from. People will not sell their stocks as the trend reverses due to the belief/feeling that they always bounce right back; they will hold their positions through the brunt of the decline and only sell as they panic out of everything, nearing a long term bottom. We have seen this through history, markets build on confidence and crash into panic. Once the levels of confidence and panic reach extremes, that is where turns in the market occur. We are not there yet and have no real evidence that its near, but do know that it will happen again, it always does.

I will be looking for these fakeout moves to no longer bounce right back. That will be a major signal of a change underfoot and will be time to be cautious with your investment capital. As long as every breakdown is bought, the bears will not be able to break this uptrend. Any change in that behavior will be a concerning change of character. For now lets just do what we do, continue to follow the price action higher.


SPX daily view
These shakeouts are becoming commonplace in the market now and a failure to bounce right back will be an excellent signal as to when the actual correction is about to occur.

SPX prior trend violation (mid-June)
Just for those pattern seekers out there, this is what the last fakeout-shakeout looked like and how it resolved. Could we see a similar result this time?

SPX Weekly
Once again, the Weekly chart sustained ZERO damage this week and during this correction. This is why I like to follow the signals from longer term charts as they tend to cushion a lot of the daily noise that goes on on Wall Street and in the media.

What we are looking at above is that since the January 3rd breakout the SP500 has managed to stay above its 20 WMA for the entire rally. That smoothing average has contained price for over 40 weeks and has had only one close below that level on a weekly basis (that close was during the last pullback and yet price reversed right back above the next week). A sustained break of that average with at least one follow through week lower will be necessary for this rally to be killed off. So far we haven't really seen too much to make us believe that the top is in for the year. There are some indications suggesting that the rally is waning (weakening momentum and fewer stocks participating to the upside with each subsequent new high) but as of now my primary trend following indicators are still pointing to the upside. 


AAPL daily view
Trading and technical study of the markets is highly dependent on finding and recognizing patterns in the price action. Here is something i like setting up in AAPL; each time the 20 DMA turned from a negative slope to a positive one, shares gave rallied in the short term. We are once again seeing this action as of this weeks close. Patterns don't exactly repeat but they do often rhyme and I expect this time to be no different. I expect higher prices here.  Typically I follow the slope of the longer term 20 week moving average for position entry, but the 20 day moving average just gives us an idea of short term momentum. The signals can be used interchangeably depending on your investment time frame. While I prefer to not take signals from short term indicators like this, I do really like to see a stock that is already confirmed on the longer term then setup this way in the short term. Having your position agree on multiple timeframes gives that much more confirmation to your original trade thesis.


HAIN
 when the broad indexes correct lower I like to find stocks that are holding up relative to the averages. When the market pulls back from its highs I like to see breakout stocks simply retest thier prior breakout levels and not end up failing the breakout. After a breakout, a stock will at some point retest the prior resistance area and is considered healthy consolidation.

Hain has spent this pullback digesting a lot of news flow and top calling. Yet, after all of these goings on, it has simply retested the prior resistance level and 20 WMA. The breakout is intact and these types of "retests" can be seen as areas to add to current holdings in a stock. I added this week in HAIN and DDD in my more aggressive accounts. A break of the $72 level remains as our line in the sand.


DDD
DDD did almost the exact same thing as HAIN this week and during this market weakness. It has merely retested its prior resistance area and is now holding as support. Positive action here and I expect higher prices. A break of this weeks lows will continue to be our trailing stop. 

Tuesday, October 8, 2013

Exting Wells Fargo (WFC)

Wells has broken below the prior swing low, uptrend support and 20 WMA. That was the criteria we were using to determine whether the risk/reward was still in our favor, and now it is not.

While the Relative Strength vs the SP500 is still holding its uptrend support, the breakdown in price has shown enough for us to exit our position and await further improvements.


You can see the breakdown of all trend support here on the Weekly view. I will expect the $34.50 to act as MAJOR support going forward, but it would be quite a gift from the market if a high quality company like WFC falls to those levels. I would become very interested in the stock back down there.

Wells reports Q3 earnings results this Friday before market open (BMO)

Friday, October 4, 2013

Weekend Update: Government Shutdown Weighs on Markets

For the first week of the 4th quarter markets remained under pressure due to concerns over the government shutdown and looming debt ceiling deadline. While damage was limited due to seemingly endless Fed liquidity throughout the week, the markets continue to trade back near significant support levels. We haven't seen unrepairable damage done yet, we will be watching to see how the next couple weeks' headlines out of Washington will impact the underlying uptrend.

More or less we in the same position we ended last week and are still waiting for major supports to be challenged. Therefore there is not too much to discuss this week but I do have a couple things that should be on your radar moving forward. 3rd quarter earnings will begin to trickle in as we are approaching another earnings season. So far estimates for earnings have been fairly positive and analysts are expecting strong quarters. Normally I prefer to see estimates being revised down and expectations lowered, not raised. These situations often create an under promise, over deliver and stocks are surprised positively. When good news is expected, companies have to really blow out the numbers for the positive surprise and typically these increased expectations lead to disappointment. So something to watch for in the next couple weeks will be to see how the market digests the early earnings reports. Next we will be keeping our eye on the uptrend support and rising wedge pattern in the SP500. It will be very important for the support to be defended if we are to believe the rally is still intact. Lastly we will be keeping an ear on Washington. The markets right now are expecting a last minute resolution with the debt limit and a failure to compromise would likely create major issues for stocks and the economy. While it will be important to be mindful of the news out of the capital, of most importance will be the technical indications the market sends as to its most likely next heading.

Lets take a look at a few charts of interest for next week:

SP500 (weekly chart)
We are still within the channel and rising wedge pattern. While we saw weakness this week, the S&P still was able to close well off the lows and above the 20 WMA. The two most significant levels to be watching will be the 20 WMA/uptrend support at 1,660 and the prior swing low at 1,627. Above those levels, everything is okay.


HD
 Home Depot has continued to weaken technically since our exit 6 weeks ago. Once price was rejected at the 20 WMA we have seen a possible right shoulder formation building that would complete a major top in HD. The 20 WMA has begun to turn lower and price is below that line, those two criteria do not lead to high probability successes as investments. This is one of the more troubling signals under the surface of the market and one we will need to watch very closely. Home Depot will reflect the health of the home building sector as well as a confident consumer. A top here and the market also will likely be headed lower. $72 is a VERY important level to hold.


PPG
 PPG continues to be a market leader, and shows why we seek out strength in the market. Even when the major averages struggle, strong stocks can buck the trend. PPG closed at a new weekly high this week and is still showing tremendous Relative Strength.


WFC
 Wells is on high alert at this point. We are seeing an uptrend breakdown and prices below the 20 WMA. However it has held its prior low at $40.80 for now. Also the long term uptrend on the Relative Strength indicator is still intact. We will continue to watch this closely as a signal is very possible in the near future. For my shorter term accounts I reduced positions in WFC by half this week after the uptrend violation, but am continuing to hold until the RS proves the move is over.

Russell 2000 (small cap index) Daily Chart
Here is the Daily chart for the small cap index, Russell 2000. We were looking at this prior high breakout a couple weeks ago and while the SP500 and DJIA have both traded well below their breakout levels, the Russell 2000 has managed to hold its breakout level. This shows tremendous Relative Strength from a "risk on" indicator and suggests a bullish stance going forward.


That's about all I have this week folks. We are still in wait and see mode as Washington headline risk will continue to have traders attention. As always we will continue to follow price and trend to determine the best path. How the market handles the support tests near current levels will likely tell us a lot.