I have been sensing something happening for some time now. In the "new age" of Fed stimulus efforts,
markets are simply not allowed, as it were, to breakdown from
significant technical levels. There is a never ending bid for stocks
(this will end at some point and that is when the tide will
significantly turn) and that is creating complacency with
investors/traders. What this market is doing is conditioning
participants to believe that "stocks always come back, just hang in
there a little longer". This is the kind of action that crashes are
built from. People will not sell their stocks as the trend reverses due
to the belief/feeling that they always bounce right back; they
will hold their positions through the brunt of the decline and only sell as they panic out of everything, nearing a long term
bottom. We have seen this through history, markets build on confidence
and crash into panic. Once the levels of confidence and panic reach
extremes, that is where turns in the market occur. We are not there yet
and have no real evidence that its near, but do know that it will happen
again, it always does.
I will be looking for these fakeout moves to no longer bounce right back. That will be a major signal of a change underfoot and will be time to be cautious with your investment capital. As long as every breakdown is bought, the bears will not be able to break this uptrend. Any change in that behavior will be a concerning change of character. For now lets just do what we do, continue to follow the price action higher.
SPX daily view
These shakeouts are becoming commonplace in the market now and a failure to bounce right back will be an excellent signal as to when the actual correction is about to occur.
SPX prior trend violation (mid-June)
Just for those pattern seekers out there, this is what the last fakeout-shakeout looked like and how it resolved. Could we see a similar result this time?
SPX Weekly
Once again, the Weekly chart sustained ZERO damage this week and during this correction. This is why I like to follow the signals from longer term charts as they tend to cushion a lot of the daily noise that goes on on Wall Street and in the media.
What we are looking at above is that since the January 3rd breakout the SP500 has managed to stay above its 20 WMA for the entire rally. That smoothing average has contained price for over 40 weeks and has had only one close below that level on a weekly basis (that close was during the last pullback and yet price reversed right back above the next week). A sustained break of that average with at least one follow through week lower will be necessary for this rally to be killed off. So far we haven't really seen too much to make us believe that the top is in for the year. There are some indications suggesting that the rally is waning (weakening momentum and fewer stocks participating to the upside with each subsequent new high) but as of now my primary trend following indicators are still pointing to the upside.
AAPL daily view
Trading and technical study of the markets is highly dependent on finding and recognizing patterns in the price action. Here is something i like setting up in AAPL; each time the 20 DMA turned from a negative slope to a positive one, shares gave rallied in the short term. We are once again seeing this action as of this weeks close. Patterns don't exactly repeat but they do often rhyme and I expect this time to be no different. I expect higher prices here. Typically I follow the slope of the longer term 20 week moving average for position entry, but the 20 day moving average just gives us an idea of short term momentum. The signals can be used interchangeably depending on your investment time frame. While I prefer to not take signals from short term indicators like this, I do really like to see a stock that is already confirmed on the longer term then setup this way in the short term. Having your position agree on multiple timeframes gives that much more confirmation to your original trade thesis.
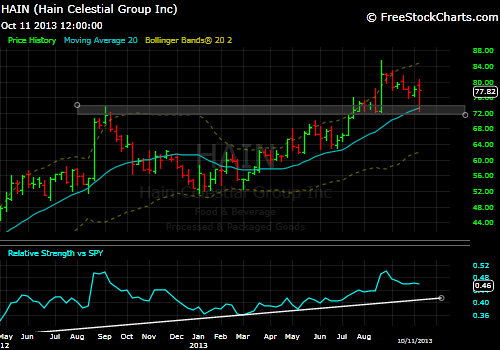
HAIN
when the broad indexes correct lower I like to find stocks that are holding up relative to the averages. When the market pulls back from its highs I like to see breakout stocks simply retest thier prior breakout levels and not end up failing the breakout. After a breakout, a stock will at some point retest the prior resistance area and is considered healthy consolidation.
Hain has spent this pullback digesting a lot of news flow and top calling. Yet, after all of these goings on, it has simply retested the prior resistance level and 20 WMA. The breakout is intact and these types of "retests" can be seen as areas to add to current holdings in a stock. I added this week in HAIN and DDD in my more aggressive accounts. A break of the $72 level remains as our line in the sand.
DDD
DDD did almost the exact same thing as HAIN this week and during this market weakness. It has merely retested its prior resistance area and is now holding as support. Positive action here and I expect higher prices. A break of this weeks lows will continue to be our trailing stop.


No comments:
Post a Comment