This was a rather uneventful week for the markets as a whole and officially starts the deepest stage of the summer doldrums. Many traders and money managers have gone on vacation, so trading volumes are lighter than normal and the market becomes prone to choppy trading. The important thing to note is that, while closing lower for the week, the SP500 was able to hold the 20 DMA and closed still roughly 1% above our key 1,674 short-term stop. Not to mention that it created yet another higher low tick on the weekly chart.

Here is a look at the Daily view of the SP500 and you can see how price held above the key support band. While it is possible that this is THE top of the market, we will not try to anticipate that and will wait for price confirmation below the 1,674 low to begin to scale back short-term positions. Long-term our key level to watch is the swing low from the May pullback at 1,560. That is still a long ways off so for now we will keep our attention initially on the shorter term levels.
The top calling has grown in size and volume over the past week; apparently sitting less than 2% below all-time historic highs is all the ammo Bears need to justify their opinions. I read a quote this week from renowned market technician Peter Brandt where he said, "
I have NO (that means NONE) interest in playing the markets from end zone to end zone. I want to play the markets between the 30 yard lines. I want you traders to consider this — if you were to never put on a trade that opposed the 14- or 21-day moving average of a market (or whatever length of time you want to establish), would you be money ahead or behind? Think about it!!!!".
What Mr. Brandt is saying is that he has no interest in calling tops (and neither should we). Also that when you are an investor in the market, managing your own money and possibly others', you should focus your attention on the longer-term trend and stay with your positions until that trend invalidates. Playing the markets between the 30 yard lines means just that. We will seek to catch the majority of an upward move and avoid the majority of a downside move. We will not attempt to pick the absolute top or bottom in the market, we will wait for the prevailing trend to shift, and we will join along with the highest probability trend.
I particularly like the last part of his statement where if you were to use a simple moving average and only take trades in the same direction of the moving average and general trend. It is nice to hear when a very experienced and successful investor reinforces the same principles that I am currently trying to employ in my own investing strategy. By following the 20 WMA I have found that trading in the same direction of that average GREATLY improves the likely-hood of a successful trade. However by following such a lagging average doesn't allow you to get out right at the top or right in on the bottom tick. But it does allow us to capture the white meat of a rally and avoid the destructive losses caused from severe market corrections; it will generally keep you on the correct side of the market. There will be some false signals, but more often than not it will catch positive expectancy opportunities and will NEVER miss the biggest moves. The key for us is to be able to stick to our plan and not let our emotions get the better of us while we watch the markets churn.
--We added two new positions to our Portfolio this week, AAPL and CMI. As of this week's close we now nearly fully invested. Being this heavy in our positioning at these levels may be concerning to some, but the fact that THIS MANY stocks and sectors are fitting our trade signal parameters shows just how strong this market is and I believe we still trade higher from here. If the markets roll over we will give some money back and we will get set for the next move. I try to take the emotion out of trading as much as I can and become a slave to my signals. I have seen the success of following the plan and have experienced the pain of not following it. When I make emotional trading choices, my returns suffer. When I follow my signals strictly, my returns improve greatly.
Lets take a look at our two newest holdings and then a couple charts of interest for us going forward.
AAPL
As I expected, AAPL has gone into a consolidation mode since braking to a new swing high. Price on the daily view has flagged orderly on declining volume, so I am not concerned at all about our entry or current position in the stock. I would like to see price firm up a bit as it nears the up-sloping 20 DMA and not repeat what happened the last time prices pulled back from these levels. The flagging action is similar to the prior peak in early May, but that weakness saw downside follow through and created another prolonged pullback. If this time is actually different (which I think it is), I would expect to see some support come in here near the $450 area. Obviously we will be watching this closely as we head into the end of the summer.
CMI
CMI saw a follow through day today and closed higher even in a down tape. That is exactly what I like to see after a breakout; strong relative strength like this signals that a shift is taking place. We also saw the gain today come on increased volume. Increased buy volume after a day of positive action is considered an "accumulation day". An accumulation day is seen as strong institutional support for higher prices. If the big guys are buying, it shows conviction in the move and adds to the probability of success. Its nice to see this confirming signal right after a breakout from a large trading range.
Currently we are holding 9 of our 10 watchlist stocks and 7 of our 9 sector ETF's. That just leaves ENB, XLB and XLU as the non invested positions on our list. Unfortunately I only have enough cash in my account to make one further purchase (this shows how invested we are at this point), so I want to make sure I choose the best fit for the remaining positions. ENB and XLB are set up the best of the three, but neither is showing quite enough at this point to signal a winner (both are very close though).
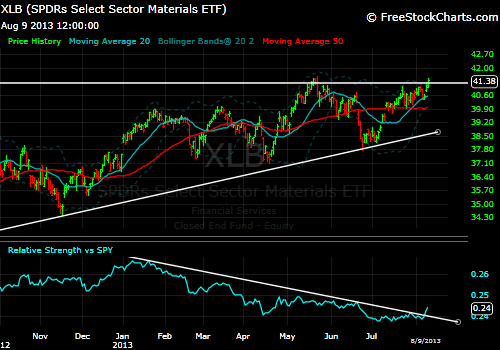
XLB
XLB is currently on breakout watch for next week to see if it can sustain its attempt at a new high. Today's trading action came on heavy volume and closed above the long term resistance. Also we saw a definitive breakout on the RS chart, signalling a potential shift in fund flows into the Materials space. If I could pick both ENB and XLB, I would have purchased XLB at today's close. Fortunately I can be a little more picky
here because I do also have another very interesting setup forming in ENB...
ENB

Granted this setup still has a ways to go and XLB is looking like it will breakout from here, but I like ENB from a longer term perspective. If you remember correctly from previous posts, ENB has been in this (yellow) uptrend channel since the 2009 lows and has shown remarkable relative strength. Until just recently, this stock was continually making new all-time highs and has now pulled back to the lower end of the channel support. Price actually failed the new polarity support at $42 and sliced through the lower support of the uptrend. That breakdown lasted exactly ONE day and it was back within the support area. That is positive action and now after moving higher, price has begun to form an early reversal setup right at lower channel support (major support, especially with the confluence of the polarity level at 42 also). I am not jumping in here because prices are below the 20 WMA (and 20 DMA as shown above) and also RS trend has not looked too favorable recently as ENB has under performed. This setup could get very interesting in a couple weeks and I will keep you posted on any changes or developments.
One potential problem for our Portfolio is the relative performance of the XLP (Consumer Staples).
As you can see from the Relative Strength chart that after following a steady upward trajectory vs. SP500 for a couple years, lately the trend has weakened and is now breaking below the support line. Price has remained firm though and has managed to hold in a very tight range for the last month and a half. If the RS continues to deteriorate we may exit this holding regardless of whether its going up or not. If we have other positions that are turning it on and outperforming the market, that is where we want our money to be put to work. If we end up selling the XLP that would also free up an extra amount of cash to purchase both of our potential winners in XLB and ENB. This one we will be watching closely.
p.s. It would be bullish for the market to see some weakness come into the Staples here. That would signal investor risk appetite by avoiding the so called "safety" stocks in the Staples sector. Also if XLB holds its break to the upside with Relative Strength, it would be a major positive for the market continuing higher from current levels. If you are a Bull at these levels (which you should be if you are reading my stuff) then you really would like to see Materials outperform Staples here as that would likely give the market a swift kick to the upside.


No comments:
Post a Comment