So far this year we've looked at short-term setups, Long-term Monthly charts, trading Short, general market psychology, etc. But this week I want to get back to the general focus and take a look at the market from the weekly perspective and our Large-Cap Portfolio holdings.
SP500 Weekly
For all intents and purposes the 1820-1810 level is finding buyers. We have now seen 3 tests of that area and each time buyers have come in to support stocks. However that makes you feel (too many tests, the market is in a downtrend, its gonna crash, Head/Shoulder Top, etc) the fact remains that while we are above this support the market is in a trading range.
We also saw this week a higher high printed over the short-term; the prior swing high on this decline was the 1/29 close at 1,940. Tactically this makes way for a potential bottoming sign and a trade-able setup. Structurally however this longer timeframe remains with a lower bias. As you can see we have negative sloping 20/50 Week MA's that are crossed bearishly (falling 20 below falling 50) with a larger trend of lower lows and lower highs.
Price is generally moving in a wide descending channel since 2015. There have been clusters of activity at each minor turning point. Each resolution of a cluster (a break through support/resistance) has offered minor trends for trading. With this week's breakout we may be seeing another of these opportunities.
That doesn't take away from the fact that the larger trend remains down-sloping. To extrapolate forward, the next price "cluster" should likely occur near the resistance zone between 2080-2000. At that point we will see how the market behaves, but the pattern so far has been to resume lower after failing at resistance.
Keeping this broad context of how the market is generally behaving is very important.
Understand that there can be trades to be made over the short-term, but that the longer-term direction for the market remains lower. This means Long trades are more likely to fail and position sizes should be reduced to account for the lower probability of success.
Our Large-Cap Portfolio is currently 30% invested: 25% Long PM, AEP, PCG, FB, GE. 5% Short CVS and GD. 70% Cash.
This is a very defensive posture with exception of the FB and GE holdings. Last week I began to leg into Short positions in CVS and GD as price entered key resistance areas. Should we receive further confirmation of weakness going forward, I will begin to increase the position size in these names. For now they remain test positions as the market has managed to show strength.
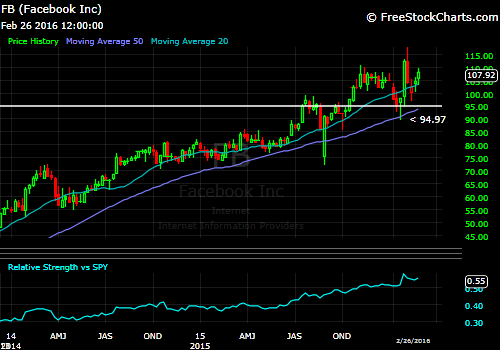
FB
FB continues to be a solid holding, both structurally and tactically. While the SP500 makes a series lower high/lower lows, FB is making higher highs and higher lows. Should the market recover from here FB is poised to be a leader of a new uptrend.
GE
GE remains wedged between its long-term breakout support and recent highs. A move below $28 would be seen as a negative and likely lead to a gap fill near $25. The longer the stock stays above $28 the better the likelihood that it reclaims 52-week highs.
AEP
Utilities reversed solidly late in the week. This brief pullback comes after a 15% rally in the past couple months for AEP. It's possible a rounded bottom has formed and a "handle" type pullback over the next several weeks builds a new support base to rally from.
PCG
The same can be said for PCG. Utes are in strong structural position, but may need some rest after the sharp rally higher.
PM
It would not be unusual if PM consolidated above $90 here for a while. It remains in a market leadership role. Should the breakout fail we would exit below support at $86.
Short CVS
CVS has returned to its Head/Shoulder breakdown point with momentum in a bearish range. The key level between $98-100 acted as support for 18-months and now is holding as resistance. We've seen a rally of nearly 15% over the past 3 weeks right back into all this supply. Price has been able to regain the 20 WMA, so there's a small victory for the bulls. But as long as CVS remains below $100 the risk is to the downside.
Short GD
GD is back to "the scene of the crime" from its January breakdown. GD has rallied $15/share in the last 6 weeks and is now bumped right against its declining 20 WMA. The band of overhead supply from $138-135 should provide a formidable battle for bulls to conquer. For now we will remain short below the weekly close from 12/24 at $139.85.
WATCHLIST- Long
MDT
HD
SHW
WATCHLIST- Short
BAC
GILD
UPS


No comments:
Post a Comment