This weekend we are going to look at the nine S&P500 sector groups and also Gold, Treasuries and the Dollar. It is important to get a good feel for identifying where the strength and weakness is in the market, and using that information to build a base theory for where the market as a whole might be headed next. We follow price and what it suggests for the health and direction of the market. We don't get swayed by the media or Washington or let emotions dictate our investment decisions. You will be hearing all about the Debt Ceiling debate over the next few weeks, about a government shutdown, about the upcoming earnings season, blah blah. This is what will dominate the financial airways, but remember it is not designed to help you make correct investment decisions. The financial media needs to be taken as entertainment, not sound investment advice.
Now that my seemingly weekly obligatory financial media rant is out of the way let's take a look at some price charts! What really matters...
SP500
The SP500 pulled back this week after setting new record highs last week. Already the top-calling buzzards are circling and are sure that
okay, this time is the one! We will stick with the trend (which is UP!) until we are proven wrong and forced to re-position. For the S&P, the line in the sand is 1,627. Although I will be watching the uptrend support for a major warning signal that the move is finally over.
XLF--cash
We currently are not holding a position in the XLF as we were stopped out on our position last month. But that doesn't mean we simply ignore one of the most influential sectors in the market. The XLF is very important from a perspective of leadership and higher general prices. While it has not made a lower low in the uptrend yet, it did invalidate my trend signaling indicators and failed to outperform the SP500. You can see last week's trading attempted to get back above the uptrend line but it was rejected on the retest and prices followed through to the downside this week. Not the best action here...but its also not quite over yet.
XLY--invested
Discretionary still looks great up here. Every time it pulls back to trend support and the 20 WMA it just pops right off, on to a new high. It has also consistently held its relative outperformance dominance over the S&P. Let's stick with this one above the $57.50 low for now as our stop.
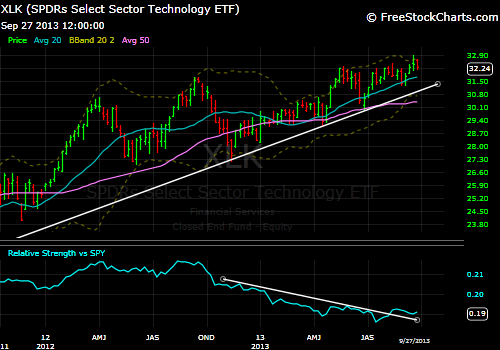
XLK--invested
Nobody's really talking about it but Tech is holding at new highs. A very good sign for the health of the overall market. Tech needs to lead here and it has been doing its best recently, seeing many breakouts in the individual component stocks. QCOM, ORCL, and AAPL are some of the notable leaders of the group. As of now we like XLK above $31.30.
XLI--invested
Industrials have been monsters lately. One of the top sectors of the past 5 months and seemingly still chugging along. They are setting new highs on every rally attempt and we like the XLI above $43.90.
XLB--invested
The Materials sector also has been a market leader for a couple months now and is still holding and trying to accelerate its move to new highs. The $40 level looks like a place to reduce risk to me and would signal a false breakout for the group. We will be watching this breakout closely as the last 2 weeks have shown poor price action. Last week the big move to new highs did not hold well forming a
long shadow above the closing price. Meaning prices were much higher intra week than where they ended the week. Thats not particularly troubling by itself, its the follow through to the downside this week that is more concerning. Although so far we have not much to build a bear case with. Its still breakout price action and needs to be treated as such until price confirms otherwise.
XLE--invested
Energy continues to grind its way higher. Strong uptrend, breakout holding, a Relative price breakout underway, and you have the makings for a solid position. A failure to hold the lows and uptrend support at $79.80 would signal to us that we in fact have been proven wrong by the market and would see our exit. As of now I believe the chart is saying higher prices in the future.
XLP--cash
While price has more or less traded sideways since our exit mid-August, the performance of the Staples relative to the market has been abysmal. While an uptrend in price is still intact for now, I want nothing to do with this space until it starts performing better compared to the SP500. The fact that Staples are performing so badly is encouraging for the risk appetite for stocks. While the media has been screaming about tops and corrections, money managers have continued to put money to work in the offensive, economically sensitive groups and have been avoiding the "safety stocks". They are showing continued belief in the rally, the consumer and the US economy. That's a positive sign for the intermediate future of the market.
XLV--invested
The raging Healthcare bull market is still in full stride. Last week XLV acquired a small triangle type continuation pattern and set a new all-time high. We are going to want to be in the Healthcare space above the prior swing low now at $48.40. Stick with aging US demographics and stick with Healthcare.
XLU--cash
While Utilities have been in an uptrend since the bear market low in 2009, they have also underperformed the market significantly during that same time. Typically Utilities outperform the market during corrections and pullbacks. Lately these have not done anything regardless of where the market went. They are relatively weak and should be avoided for short/intermediate term trading. However for a long term investor, trying to build a position through time and collect dividends, I think (in terms of price trend alone) that the XLU presents a fine opportunity to purchase a partial position near these levels. XLU is trading right along its 5-year lower support line and offers a good risk/reward add to a cost averaging plan.
GOLD

After being punished over the past year, Gold is trying to turn things around. For several months now it has attempted to build a support base to launch from. While things are beginning to form, I still believe its too early to make the call that the bottom is in. We are still yet to see a higher high and the 20 WMA is still sloping lower. What I could envision happening here is what I have drawn above; a potential base reversal pattern that still needs time to complete the right shoulder formation. This consolidation would allow the 20 WMA to catch up and Gold could position itself for a rally through it at that time. Currently there is no trade and if I had to take a position in Gold, i mean had to, (I truthfully don't like either direction here) I would still favor the short side due to the little evidence of a bottom being in place. In my Plan, breakouts above a declining 20 WMA are not to be trusted as they are often false breakouts. We can see a perfect example of this over the past 6 weeks; price ripped through the 20 week, but saw zero follow through to the upside and has since slipped back down below... I need to see more than that. Gold is telling us fear is low, markets have confidence, and we should maintain the current course...for now.
TREASURY BONDS
Despite a whole lot of noise as to the direction Treasury bonds are headed next, I think its important to take a look at the longer term view and form our own opinions. What I see doesn't look anything like a bottom in prices here. I do believe the relentless downtrend does indeed favor a counter trend bounce, but the overall direction is lower, clearly. We have price below a sharply declining 20 WMA, a two year reversal topping pattern in play, and no discernible support until the $96ish level. I am not a Treasury bull here and this shows little sign of a "safe haven" asset at this time.
US DOLLAR
Speaking of safe haven assets, the US$ looks to be breaking down here on the intermediate term chart. We've seen a pullback to uptrend support (this support has held since mid 2011) and then a failed bounce as price got rejected right at its declining 20 WMA. Since the failed bounce the Dollar has broken below both the uptrend support and the prior lows. What do we get when you see a lower low? thats right, a broken uptrend. We would have to see prices get back above the failed bounce high at $83 to believe this was going to turn back around. As of now investors don't seem too concerned with safety and are not seeking the shelter of the world's reserve currency.
Overall I would say this market passes the test with flying colors as to the current trend. Every offensive sector sans Financials (although like we said its not quite dog-meat just yet either) are in uptrends, relative outperformers and making new highs. While simultaneously the defensive (safety) groups are ALL showing downtrend/weakened action and suggest a high investor appetite for risk assets. To me this means we still stick with the trends and ignore the fear invoking news out there. Follow price and we will be on the correct side of the market every time.
**Something to note going forward, I have been toying with the idea of instituting a partial profit taking option on trades where we have a chart pattern target acquisition and/or approaching significant overhead resistance levels. Currently with my personal accounts I have a particular exhaustion reading that I follow to determine a profit taking place with a stock that is moving very fast and exceeding standard parameters for risk management. Recently as well I discussed our holding in Ford where we had a target acquisition on the Double Bottom pattern we had been watching. I said that it would likely struggle at these levels to push higher and could see some choppy trading. Well, we certainly have seen that type of trading for the last couple months in F and its all occurring just under a major resistance level (which is also our new breakout level for the multi-year Inverse Head/Shoulder reversal pattern. What I am suggesting going forward is that when a stock or ETF we own moves into extreme overbought levels or acquires a key pattern price target at a major resistance zone, that we consider taking half our original position off the table. We still want to be a part of a winning position and don't want to pick the exact top, so we will continue to hold half a position should the stock just keep on moving higher regardless of a skewed risk reward setup. The plan at that point would be to look for a key support level to be tested on a pullback OR a breakout above the major resistance to add back the other half of the position. Now this is strictly a profit taking strategy and for those of you with taxable investing accounts, you may feel its not worth making the sale to avoid the capital gains tax you will incur due to the sale. I will simply present the opportunity to reduce exposure to a particular stock based on the above criteria and you can choose to hold the entire position or follow my game plan and trim half the shares.
What I don't want this to evolve into is an excuse to sell a winning position because its run too far or gotten too expensive. We can never know how far a trend could persist and you never want to exit a full position when the position is winning and not invalidating your sell signals. I don't want this to become an emotional outlet to our investing; we are not emotional investors, we observe price action and follow its cues. All I want to do with this new wrinkle is add a way to sell SOME shares into extreme strength, strength that my system and research deems unsustainable. And I want a way to reduce exposure to a stock once a major target objective has been achieved. Investing is a process and our strategy can always use a little tweaking from time to time. I would like to try this added portion and see how it goes.
Profit Taking Opportunity
F- ford

I know we talked about this recently and the potential pattern formation that could trigger a move back to prior highs over the next few years. This is simply one of my "new" opportunities that I want to try instituting into the Plan. What we have here is a Double Bottom pattern that acquired its upside target which was right at the edge of our resistance "neckline" range for the potential base breakout. We have held our position throughout and now price seems to be forming what looks like a Double Top and short term momentum is rolling over. What my new profit taking option would look to do here is to take half of our current holdings off the table and wait for either a pullback to uptrend support, which is around $14.50 or so. Or if we where to get that breakout above the neckline range resistance, triggering the reversal pattern. Those two scenarios would be what I would be looking for to put the other half of the position back on. Nothing here has invalidated the uptrend, but I am noticing a potential major sticking point and the stock is being sold at these levels. If you wish to continue to hold a full position here i have no problem with it, just know that this seems to be a level where risk is more skewed against us. I reduced positions by half and if you are planning to do so, execute them at the open of trading Monday morning. If not, continue to ride this winning name.
PBW- clean energy

Clean Energy is in a similar position as Ford. This past week PBW acquired its reversal target and is now approaching an area where the history of the price suggests a struggle ahead. $6.45-6.50 represents a prior inflection point going back to mid-2011 through early 2012; that level held as support and then turned into resistance twice as prices failed to take out that area. It also represents the 38% retracement from the 2011 highs, which typically is an area of significant support/resistance. Throw in the fact that we are completing a multi-year base and you have the recipe for consolidation. I do believe that in time we will see this level taken out, but I would rather reduce some risk at these notable levels and wait for a better setup to make a run at these prior highs. Again, there is nothing wrong with this trend and holding a full position here is not bad. I am merely presenting these opportunities for those who would wish to be a little more active with their investments.


No comments:
Post a Comment