Saturday, December 6, 2014

Energy is Crashing. Who Wins, Who Loses?

Something I have been enjoying the heck out of recently has been watching the crash in Crude Oil and the stocks that represent the Energy sector. I have enjoyed it because I have ZERO exposure to Oil in my portfolios and haven't since mid Summer. This is what Relative Strength investing does; it keeps you positioned toward the strength in the market and away from the weakness. Relative Strength and trend analysis signaled problems with Energy names several months ago and have avoided most of the recent declines. Let's take a look at a couple Energy stocks to see how this has played out.

Halliburton
The stock of Halliburton, one of the world's largest oil service companies, has crashed nearly 50% from its highs just 5-months ago.

Looking at the Relative Strength trend for this timeframe shows two distinct exit points where the flow of funds was shifting negatively:
Once the stock failed its 20 WMA, RS had already broken its steep uptrend support and was signalling that the the trend was failing. That was your first signal to sell; worst case scenario was for that sell signal combination was an exit at the $62 weekly close.

If you had taken a longer-term view you may have been willing to give it more room to prove the uptrend wrong. By waiting for the longer-term (blue) uptrend line to fail would have signalled an exit in the ~$50 area. Either way you slice it, following this simple trend recognition signal could have saved you much of the pain from this meltdown.

EOG
EOG is one that I have personally been heavily involved in since early 2013. Above are my actual exit points for my personal accounts. The first exit was for my very aggressive short-term accounts and the second was the full trend invalidation for the Weekly timeframe I use for managing private investment accounts.

In hindsight the first exit was clearly amazing, although at the time I didn't know if it was going to be just a pause in the uptrend or a full trend reversal signal. This is what a very aggressive trend strategy will get you, but it will also often just be a pause that then resumes higher and makes it difficult to get back in once you sell.

The second exit was about as clear as a long-term trend invalidation gets. Price had consolidated at the 20 WMA, but then broke those support lows, the 20 WMA and the 2-year uptrend support trendline. Using RS as a confirming indicator we can see that it too suggested a change in trend at that same time:


Remember when I said to be patient and not go rushing into Conocophillips (COP) and that the key support would need to hold?

Here is what happened...
This is a great example of what tends to happen when a stock rises rapidly and unsustainably steep. All big trends eventually end badly, COP has found some support around the $64 area but will need to hold that NOW to fend off another steep drop lower.

ALL OF THESE ENERGY STOCKS ARE IN "NO TOUCH" MODE.

We don't try to pick tops and bottoms with a trend method, in my view none of these stocks are showing signs of a sustainable bottom being set. There will likely be sharp rallies that convince many that the lows are in, but that is a sucker's game. We will need to see significant firming price action before our signals begin to trigger new entries into these names.

I think now is a great time to make a list of your favorite Energy names and be ready for when the trend shifts back upward. You want to know exactly what you will buy BEFORE the trend changes higher. That way you will not be second guessing yourself and just emotionally buying whatever the pundits on TV say to buy.

Large declines present opportunity...eventually. The trouble is most people try to front-run the actual bottom by continually taking shots a catching the lows. It is a much higher probability to wait for the trend of lower highs and lower lows to end before even attempting a new entry.

So watch Energy for new opportunities in the coming year as all trends, both up and down, will eventually reverse course. You will want to be on the right side of these stocks when the trend turns for the better.

So Who Wins?

So if Oil is tanking and Energy stocks are following, who is set to benefit by these lower prices?
Anything Consumer focused should do well, as well as anything involving Transportation, i.e. Shippers and Travel.

Lower Oil prices mean lower gas prices, lower gas prices mean more discretionary income for consumers to spend and lower costs of fuel for vehicle operation.

A couple of my favorite picks that are already benefiting from these lower prices are:

Starbucks (SBUX)
Carnival Corp (CCL)
United Parcel Service (UPS)

Each of these benefit from from lower gas prices and higher discretionary income from consumers. Their price charts reflect this shift:

SBUX


CCL


UPS

Each of these stocks hit higher highs this week, in the case of SBUX and UPS those highs were new all-time highs. These names and many others like them will continue to benefit from reduced oil prices. The nice thing about these names as well is that the price of oil doesn't even have to continue tanking for them to see benefit. The longer oil stays below about $80 these companies will see increased traffic and lowered costs which equal increases in earnings per share (EPS). As earnings rise, stock prices rise. Lower costs and higher sales are a pairing made for record stock prices.

The beauty of these setups are that the decline in oil has been so rapid that we have not even seen the effects reflected in the quarterly reports yet. These reduced costs should fuel EPS for several quarters before their true values are understood. Continue to go toward the strength in the market.

Long-Term View Suggests More Upside Potential

At the end of each month it's important to take a look at the long-term view for all your stocks to keep a bigger picture perspective. So much can get lost in the daily noise of the market, seemingly insignificant movement on the long-term timeframe can evoke a lot of emotion in the shorter term. By running through this simple exercise each month will keep you aware of why you really like the setup and how the position can reward you for more than just the next week or two.

The monthly bar charts I feel are generally too slow of a signal to be traded, but the general direction of the stock or market is much more apparent from this broad perspective. This view allows us to see the forest and not just obsessing over each little sapling in the undergrowth. 

We always want to be investing with the long-term trend in our favor. Being able to identify that general direction will do wonders for your account balances. 

Let's look at our holdings in monthly bars to see what the big picture has to say.
Charts reflect monthly closing prices as of 11/28/2014.

DIS
Our newest position, Disney, has the look of a runaway uptrend. Since breaking out above its consolidation area in 2012 DIS has never looked back. This sort of parabolic rally will concern some, but as Charles Dow once said, you never can know where you are in a trend. A trend will continue beyond what most feel is reasonable, so it's better to find a place to jump on until it comes to an end. By managing your risk you can still own a stock that has moved significantly higher  because we know where we are wrong and will step aside before anything too damaging occurs. 

Disney is a winner, there is no doubt about it.

NKE
Nike has made a moonshot over the past few months, but that move came out of a nice continuation "flag" area. As you may recall we entered the position just as the stock was emerging from that consolidation. This is exactly the kind of action you hope to see when you buy a stock. Most people would want to sell here, but let me ask you, why would you sell when the stock moved how you hoped it would? 

TLT
Treasury Bonds have been a choppy long-term trade, but since the beginning of 2014 the trend has been exceptional. There is still a clear pattern of higher lows and higher highs, so we would expect another new high based on how it has moved over the past 10 years. 

UNH
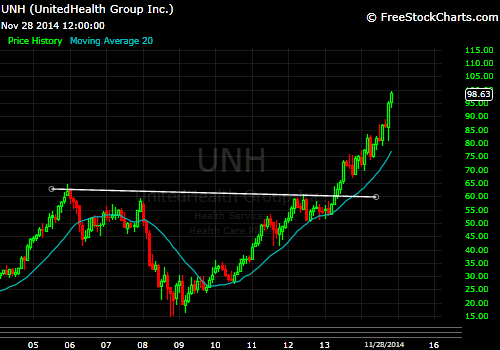
Since breaking above it's prior highs near $60, UNH has been on a tear. The 8-year base has the look of a Cup/Handle pattern and would still suggest more upside to come. Regardless of the fancy names you give it, since 2010 price has consistently made higher swing lows and higher swing highs. This is strong trending action and we want to continue to take advantage of the move until it ends. 

BRKB
Berkshire has been extending strongly since 2013 and after breaking through the 10-month consolidation coming into 2014, the stock has been a leading performer. The move is getting a bit steep but as long as we continue to trail our stops and manage risk we can stick with it until it's done. 

BMY
BMY had a huge month of October closing at new highs. The recent pause has created yet another higher swing low and the trend is still obviously higher. Using NKE has an example, price here could still be getting going since resting for over a year. The bigger the base, the higher the move in space. 

SBUX
I believe Starbucks is ready for another leg higher. Since working off its huge rally, price as corrected over the last year +. This formation has the look of a continuation "flag" pattern and could extend significantly higher. The last time the stock behaved similarly was in 2012 which led to a nearly 100% move. It's certainly possible that something similar happens again. 

GS
Goldman is just now emerging from a significant base formation. Breaking through $180 was a major psychological win for the a stock. The type of move that can come from a base this size could surprise many. I think a retest of the all-time highs is very likely and possibly a move beyond is certainly not out of the question. 

PPG
I really like how PPG handled its recent correction and is now resuming to new highs. While the correction seems muted on the monthly chart, the weekly and daily charts show the high volatility from that October swoon. In hindsight this appears to have been just a shakeout move before continuing another leg higher. 

HAIN
HAIN has emerged strongly from its 10-month consolidation and is pushing to new highs repeatedly. When a stock moves this hard in our favor it is best to just get out of the way and let it work. To see another brief pause after this big move would be constructive, but longer-term this trend is about as good as they come. 

UPS
So many of these setups look similar to one another but are just at different stages. UPS is just now breaking out from its support area and looks poised to make another strong surge. 

PCG
PCG looks ready to explode to the upside. After trading sideways for the better part of 7 years the breakout above the resistance area shows a sentiment shift for the positive. What I like about this chart too is that despite correcting during the financial crisis, prices regained their footing quickly and have been pressing against all-time highs for a couple years now. This shows a strong underlying support for the stock and should propel it higher now that the primary resistance has been broken. 

IP
Speaking of ready to explode, IP looks ready for a pop after resolving its sideways trend over the past year. This has it all, a strong uptrend over the past 5 years, a year long support zone to launch the next move higher and new decade highs are being printed regularly as the trend resumes to the upside. When we look back on this breakout in several months I bet we see this previous 10-year trading formation as a type of Cup/Handle pattern; the recent consolidation certainly looks like a nice handle formation. If this is the case the stock would have serious long-term prospects. 

GILD
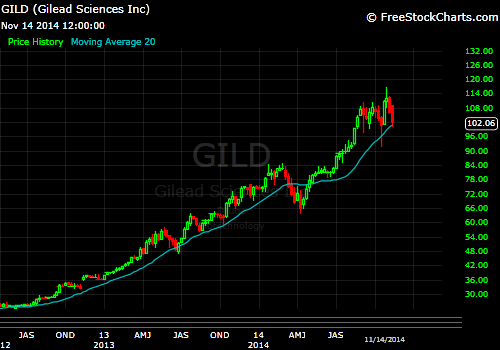
GILD has been a monster performer since 2012 gaining more than 400% during that time. Shares have recently experienced some increased volatility but the long-term trend is obvious. As long as you use sound risk management principles there are still plenty of chances to participate in a stock like this. Just know that went a trend like this ends it doesn't usually end well. Holding onto a losing position as the trend begins to fail could cost you and your account balance dearly. Be sure if you choose to invest in a name like this that under no circumstance do you get married to the position. If it begins to turn against you, get out and protect your capital. Trends like this are great to participate in on the way up, but they can be equally spectacular on the way down, so plan your trade accordingly. 

Friday, November 28, 2014

Entering Disney (DIS)

Due to the holiday weekend I'm not able to post a full weekend review, but there is a new entry signal triggered in shares of Disney.

We will be entering a position as the stock appears ready to resume the long-term uptrend higher. Due to the recent consolidation we are able to enter and have a strong position size due to the relatively close stop placement.

The recent price consolidation has the look of a Cup/Handle or Bull Flag formation. After the sharp decline through Sept-Oct, shares have snapped back and are now at new highs. Prior to this week's breakout price consolidated again forming the Flag or Handle and is suggesting higher prices in the future. 

We can place our stop below the higher low formed by the Flag/Handle. That area also coincides with the rising 20 WMA. If price were to fail that swing point we would want to step aside as more consolidation would be likely. 

Taking a look at the Relative Strength vs the SP500, you can see a steady trend higher and this recent correction in price also found support right at the Relative uptrend going back to the '09 lows.

Our risk is well defined on this trade and a stock a all-time highs gets the benefit of the doubt. This is an easy entry here.

Thursday, November 27, 2014

Plenty to be Thankful For

In the spirit of Thanksgiving, I would like to pass along an article I came across this week:


Being that this was a shortened and distracting week for investors, I simply want to piggy-back on last week's theme of noticing what we have and where we have come. Instead of focusing on all the negatives around us, let's take a few minutes this weekend and really see some things to be thankful for. 

Have a happy Thanksgiving and I will see you all next week.

Sunday, November 23, 2014

America is at All-Time Highs

The market once again closed at a new all-time high this week. If its not apparent by now that new highs are not a bearish indicator then nothing I can show will convince you. I have been writing about new stock market highs since early 2013 and the market has continued to produce them routinely for over a year. Most ordinary investor folk believe that when the market is at highs it is time to sell; they believe "stocks have gone up too much". The statistics however simply do not support selling into new all-time highs, or even new 52-week highs for that matter. New highs lead to more new highs; by their definition when a stock or market makes a new high that is a positive sign, a sign that things are working and should not be a signal to sell.

Since early 2013, when the market made its first new high in over 6 years, the SP500 has continued to rally another 400 points or 25% from the original breakout. If you take your advice from ordinary investors or the financial media you likely have missed that move in fear of some unfounded scare tactic.

The point is that America is at all-time highs. Most people will not acknowledge that as truthful either. There is a quote that says, "the world continues to improve, yet people believe that things are always getting worse". This flaw in thinking is usually caused by some political or emotional bias based on some preconceived ideas of conspiracy or malfeasance directed at the government. Any number of popular theories can lead to these ideas:

-The Fed is artificially inflating our currency and economy to sure future disaster
-Democrats or Republicans are ruining the country for any number of reasons
-Some sort of war will erupt and destroy life as we know it
-All data supplied by the government is corrupt and intended to deceive our confidence
-An individual has an opinion and regardless of facts, their opinion is all that matters

These flawed ideas are typically created by some form of recency bias, be it the 2000 and 2009 stock market crashes, recent political elections, some "very believable movie plot", opinions of their parents/friends, etc.

If you constantly live waiting for the next disaster or think that everything you read or see is an intentional deceit, you will simply not live a very fulfilling life. But if you step away from opinion and bias and just observe facts you will see what is actually going on right in front of you. Here are just a few facts showing that things are really not so bad:

-Life expectancy in the US is 79.8 years, an all-time high
-Infant mortality rates in the US are 5.2 deaths per 1,000 live births. By comparison in 1980-85 the number was double that.
-Percentage of the US population with a college education is 43.1%, an all-time high

People will assign blame to any number of exterior causes to explain their "bad luck" or struggles in life. But the simple facts are we are living longer, our country is more educated than it has ever been, the survival rate of our offspring is at its highest in human history and our best economic indicator (stock market) is at all-time highs.

You can argue with that all you want, but those are the facts. The other "doom and gloom" theories are just that, theories. They have little backing in the data and simply don't matter to day-to-day life. What good has hating the president or Federal Reserve gotten you financially over the last 6 years? If you acted against the status quo, you likely have not benefitted in any way by one of the largest market rallies of our history and don't have anything to show for it except sour grapes and how "you will be proven right at some point". Good luck with that. I will continue to observe the facts and adjust my lifestyle and choices accordingly.

SP500
Its really been impressive, the most recent bounce back from the October low. The relentless bid continues as any sign of weakness is bought. I have to imagine that a pullback is in the near future, but there isn't much reason in trying to anticipate it. The market has to be given the benefit of the doubt and as long as the SP500 can stay above about 1,900 there isn't much to worry about.

My sector data continues to gain strength as the stocks trading above the 20 WMA moved from 60 last week to 62 this week. This suggests that the trend is still likely headed higher and positive support for the market is in place.

We have two new entries for our Portfolio this week. They should both be familiar to you if you have been following this blog for any amount of time. This week we are entering PPG and SBUX.

+Entering PPG (PPG)
PPG is one of my favorite stocks, so when it acts right I like to be an owner of the shares. Since taking our exit on August 1st, the stock has traded erratically. First moving to a low near $170, to trading at an all-time high at $215 just 5 weeks later. Fortunately for us PPG did take a little pause and built a nice swing point to put a stop against right at the $197 level. This little swing low allows us to own this stock as it keeps our stop only about 8% below our entry price.

You can see this swing point better on the Daily chart:
The pivot created on November 4th emphasizes a solid support zone going back to the previous support last summer. This will give us plenty of clarity on the stocks future direction by how it handles a test of this previously important support level. Above that swing the stock is in full breakout mode and below it the trend becomes more muddled and risky.

My two favorite confirmation indicators look tight on the weekly chart, giving more confidence to a strong entry at these levels.


+Entering Starbucks (SBUX)
Since our previous failed trade, the stock has been forming another higher low. This week price was able to break above the most recent swing high and seems ready to resume to the upside. For initial stop placement I am leaning toward the major low that was formed in October. Stops should be placed at $73.35, but can soon be moved to the $77 area.

Lets not forget why we like this one:
I hope we are going to see a similar resolution of this wedge pattern as we saw in late 2012. The last time the stock acted this way it went on to rally 100% over a 1-year period. I believe we could see that happen again.

Our indicators look solid here as well:

With this week's new entries, that brings us to 13 holdings:

UNH    +22%
NKE     +18.7%
BMY    +14%
HAIN   +12.3%
BRKB  +11.6%
GILD    +5.6%
TLT      +4.8%
GS        +2.4%
IP          +1.3%
PPG       0%
SBUX    0%
PCG      -.06%
UPS       -1%

Continue to let those winners run and keep any losses as small as possible.


Chart of the Week

So you want to make a bet against the price of oil rising? But you are uncomfortable shorting in the market, so making an outright bet against oil prices seems unlikely...Then how can we take advantage of weaker oil prices without directly shorting oil?

Look no further than Carnival Corp (yes the cruise ship company)!

Carnival Corp (CCL)
As you are likely aware the cruise industry hasn't exactly been hitting it out of the park for the last 10 years or so. Something to do with being toxic waste dumps, stranded sinking death traps, or petri-dishes teaming with ebola/noro/"insert sickness of your choice". Pool that all together and you get some negative news flow and hesitant consumers, which tend to equal lower profits.

Yet if you look at the stock something interesting has been happening. Despite the negative news, CCL has continued to make higher lows since the '09 market crash. Also what is very interesting to me is if you flip the monthly chart of CCL over, it begins to look very similar to the chart of oil:

OIL
With oil breaking down from its multi-year support range, the price to do business for the cruise industry is decreased substantially. A company like Carnival is set to profit big from lower oil prices as their costs decrease AND their customer base has extra discretionary spending due to the savings at the pump.

If one wishes to participate in falling oil prices and wants an easy way to play it, CCL seems like a good fit. They have costs on their side for the foreseeable future and have a consumer with a steady tailwind to their backs. That pairing equals profits.

CCL:OIL
Don't believe me that CCL likes falling oil prices? Just one look at this chart showing CCL vs OIL should say it all. Relative to OIL, Carnival is making a monster multi-year breakout and should set up an excellent risk/reward trade for the intermediate term.

Any longer term position should be based on a stop at the most recent swing low on the Monthly chart. $36 is where the stock should hold on any pullback. If that level were to fail, this analysis is no longer valid and defensive measures should be strongly considered.

Sunday, November 16, 2014

Quick and Dirty

Its a short and sweet review this weekend as the market continues to hover at its highs. With an environment like this you need to step back and just let your winners breathe. Remember that markets go in both directions so some normal consolidation should be likely soon; don't be shocked to see pullbacks in the near future. We have no changes to our Portfolio so here is a quick look.

Just charts, no commentary
(weekly view)

NKE


TLT


UNH


BRKB


BMY


GS


HAIN


UPS


PCG


IP


GILD


Our charts all move from lower left to upper right. That tells me we are investing the correct way. We are investing with the trend and with the path of least resistance. While there were no changes to our holdings this week, I would like to point out two names I'm watching closely next week to see if any follow through can come from their mild breakouts this week:


Cisco (CSCO)


Verizon (VZ)


Sunday, November 9, 2014

Weekend Portfolio Update


The market continues its moonshot and once again closed at all-time record highs. This is why we wait for the market to take us out and don't try to anticipate future movements. While most of the financial media world, myself included, were very cautious on the market during October, the market has a mind of its own and will do as it pleases. This is why we wait for individual stocks to invalidate our trade rationale and why we don't just sell everything to make the pain stop. If you approach the market correctly you shouldn't be experiencing much pain regardless of the action. Your risk is predetermined by your trading rules and you simply stick to the trend until the trend begins to fail. Everyone that felt negative and then acted on those feelings has been left in the dust.

While our portfolio was not left unscathed during the recent decline, we did come out the other side with only the strongest stocks in the market as our remaining holdings. We have since participated in the rally and have found new names that are setting up and breaking out as the next batch of leading stocks.

We have two new entries for our blog Portfolio this week: United Postal Service (UPS) and International Paper (IP). With the two new entries we now hold 11 positions:

Nike (NKE)                                  Consumer Discretionary
20-year Treasury Bonds (TLT)    Rates
United Healthcare (UNH)            Healthcare
Berkshire Hathaway (BRKB)      Financial
Bristol Myers Squibb (BMY)      Healthcare
Goldman Sachs (GS)                   Financial
Hain Celestial (HAIN)                Consumer Goods
United Postal Service (UPS)       Industrial/Transportation
PG&E Corp (PCG)                      Utilities
Gilead (GILD)                             BioTech
International Paper (IP)               Basic Materials

Its no coincidence that we own what we do. If you like stories and fundamental "reasons" for your stock positions, I can describe each of the major talking points for our portfolio. First off, interest rates are low, that supports higher Bond prices and rewards companies that pay substantial dividends, specifically Utility stocks do well in a low rate environment. Financial stocks are also poised to do well as interest rates begin to rise, which many participants believe is in the near future. Next I could say that due to drastically declining oil and commodity prices Consumer, Transportation, and Materials companies are setup to do well as their input costs are being lowered seemingly daily. That savings adds up over time, especially for the consumer who basically sees the equivalent of a tax break due to lower prices at the pump. And lastly Healthcare and Biotech companies are thriving due likely to the increasing number of Baby-Boomers needing health care services.

Those all make up a nice story. So there you go, if you need a narrative to feel secure in your holdings I just formed a nice one for you. Funny thing about narratives however is that they are formed only after prices suggests something is going on. If you waited for the story to get excited about the stock you would often miss half of the move. This is why I prefer to let price lead my investment decisions, as more often than not I have already made substantial gains by the time the media has caught onto the story.

On that note, we should no longer be paying attention to YahooFinance and CBNC for market news. The place for all happenings about your stocks is StockTwits.com. Check it out! Play around on there, respond to ongoing conversations (try not to be a jerk  : ), and look up a few of your stocks and see what's going on. Its real-time data and about 10 solid minutes ahead of major media.


--Lets take a look at each of our holdings and see where we stand with the market at all-time highs, starting with our two newest holdings:

+Entering United Postal Service (UPS)
UPS has been a stock in a box for over a year. This week we are seeing a defined breakout above the prior highs. Relative strength has broken out from its downtrend vs the SP500 and is signalling outperformance. Lastly the MACD is showing that the year long consolidation was simply a pause in the longer term uptrend by reversing higher at the Zero line. (remember why we like this?)

Pretty straight forward here.

UPS monthly bars
Looking at the Monthly chart of UPS you can see the large sideways range the stock has been in since its IPO in late 1999. At the beginning of last year the stock made new all time highs, and after traveling a bit higher, it since has been trading sideways "resting" after the large rally higher. Only this week did we see a solid breakout move above the range highs. This signals that the uptrend is resuming higher.

Using both the Weekly and Monthly charts I want my stops to be placed right at $96. A break of that level would not only be a failed breakout but it would also take out the range lows, suggesting that more digestion is needed. Then looking at the monthly chart, a failure of $96 would also break the rising 20 MMA which tends to be good trailing trend support. If price consolidates over the short term we could then move stops up pretty quickly to the $100 level.


+Entering International Paper (IP)
Ugh, as goes the life of a trader... You buy the breakout, it rolls over, you end up selling at the low, and then have to watch the stock resume to the upside. Its frustrating when it plays out this way; this what's known as a whipsaw. As legendary trader Ed Seykota once said, "if you want to avoid whipsaws, quit trading."

The market loves to frustrate you, but the best thing to do if you get caught in a situation like this is to simply continue to take your signal and treat this new trade like the previous one never happened. Its not easy to do, but this is imperative for your investing success.

As you can see IP has it all right here: Strong breakout above a key resistance level, confirming rotation by the RS breakout and a MACD that suggests the trend is still higher and ready to resume to the upside.

IP monthly bars
The Monthly chart looks even better. After a torrid run in 2012, the stock needed to cool off and spent the last year + consolidating those gains. The risng 20 MMA was able to catch up to price and offer excellent trailing support. Not only did the 20 MMA act as support, but the confluence of that and the uptrend line from the 2009 lows was just kissed before sending this stock recently higher.

Initially it will take a break of $46 to stop us out, but looking at the monthly view we will be able to move that stop higher once price proves it can hold above this lengthy consolidation breakout level.


Nike (NKE)
NKE continues to push to new highs. The breakout is confirmed and there is nothing to do here except get out of the way and just let this one run. For now stops should be placed at $81.50, but soon we will be able to move them up to the $87 closing lows.

Treasury Bonds (TLT)
Since spiking 4 weeks ago, TLT has been steadily trading lower. We have strong trend support at $116 and will be watching closely on any test of that area. For now though, the trend is higher and we will continue to hold Bonds.

United Healthcare (UNH)
Despite this week's slight struggles UNH has been on an absolute tear the past month. This stock continues to make new highs and higher swing lows. There is nothing to do but let it continue. Stops should be below trend support near $84.

Berkshire Hathaway (BRKB)
Berkshire made new all-time highs this week and continues to act very well. They announced earnings at Friday's close, so we may see some short term volatility. When a stock continues to make new highs we just want to let it work, so work we shall. Stops should be below the swing low and 20 WMA, just about $132.

Bristol Myers Squibb (BMY)
Speaking of rocketships, BMY has been in launch mode for the past 3 weeks. Since price has been straight up we still need a wide stop to make sure we capture all this has to offer. Stops should be placed at the swing low near $50.

Goldman Sachs (GS)
Goldman finished higher on the week and seems to be resuming higher after the recent pullback. Nothing to not like here, stops should be at the swing low near $177.

Hain Celestial (HAIN)
HAIN continues to impress and is trading at all-time highs. Again we let winners run, and this one is winning. Keep your stops out of the way and below the swing low at $96.

PG&E Corp (PCG)
Considering PCG's big move over the last couple weeks some constructive consolidation seems likely. The breakout here is of the long-term variety so we are giving this a lot of room with stops down at $44.

Gilead (GILD)
GILD is reversing a bit and is part of the hot biotech space. Some prolonged digestion of the recent uptrend would be positive. Our stops need to be below the recent support zone, the $100 area looks like a good place to be for now.


Well that about does it for our Portfolio. Often the best thing to do is simply sit on your hands and let your winning trades continue to work for you. You don't always have to be trading, You don't always have to be doing something. The key to hitting big winners in the market is simply to let it happen. So often traders want to pick this top and take those early profits in fear of giving them back. If you want to win you need to be willing to do what so many are not. You simply need to act in the way that often goes against your emotions and what "feels" right. What feels right is rarely the best course, but investing doesn't have to be difficult. Have a plan, stick to it and continue to execute your plan regardless of market conditions and headline noise. Price will tell you everything you need to know. A pundit on CNBC will not grow your returns, but a systematic method for identifying high probability situations will.