Saturday, July 12, 2014

Top Down or Bottom Up?

Top Down or Bottom Up?

This is a philosophical question every investor has to ask themselves: Do you take a Top Down approach to your market analysis or a Bottom Up? Depending on the answer, you may have very different views of the market. Currently a Top Down view would be considering that while the markets are in uptrends, they are extended and due for a correction. Your view would be cautiously optimistic. If you use a Bottom Up method, you are likely finding many interesting individual stocks that fit your risk parameters. Lets take a look at what I mean with examples of both methods.

Top Down 

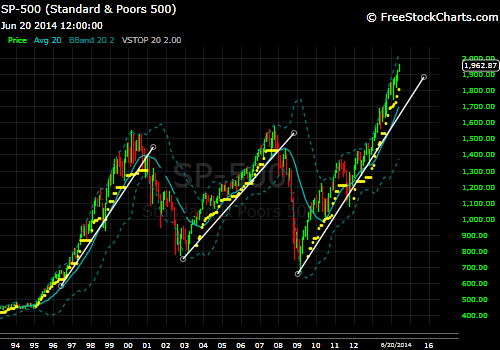
The broad markets have rallied strongly for several years and especially over the short term we may be seeing the early stages of a decent pullback.

The longer a trend is in place the more concern you begin to hear from overeager participants. A hint to studying trend is to attempt to identify where you currently are in the total move. One way to do that is to watch for the slope of the uptrend to change. As the slope increases, the sustainability of the trend begins to degrade and caution is warranted. Here you can see that while the trend is certainly higher over the last 5 years, the slope of the trend has continued to steepen over time. The steeper it gets, the more likely a reversion to the mean becomes. Ultimately there isn't a good way of timing when a move like this will end, but as it continues to increase in slope, the risk of capital loss increases as well.

Taking a closer look at this view, price is testing the upper channel resistance area on the Daily chart.
Each time that prices have rallied into the upper boundary here we have seen multi-week consolidation activity, both through time and price. This current setup suggests the market is extended and needs a breather. Roughly 4 out of 5 stocks trade in sympathy with the general market, therefore if a correction in the market comes, it will likely affect most of your open positions.

Again, from a Top Down standpoint the trends are still pointing higher longer-term, but shorter-term things look less than optimal. The leading sectors for the year so far are Utilities, Healthcare and Energy, while Discretionary, Industrials and Financials are the weakest. Typically in strong markets these performers are usually flipped. If you are a Top Down investor it would likely be a good time to be reducing exposure at these levels.

Bottom Up 

Or should I say "Bottom's Up!", because some people think you would have to be dumb, drunk or both to be buying stocks at current levels. If 4 out of 5 stocks will trade lower when the market trades lower, why take extra risks here? Why not just hunker down and wait for the next correction? My answer to that is, if you have been waiting for a correction to put money to work, you have been waiting for over two years now and have missed one of the best investment opportunities of your lifetime (if you are an old guy/gal). You would have been worrying about the market being extended for a few years, yet it continues to grind its way higher.

If you had a Bottom Up approach you no doubt have found ample low risk setups over the past few years and have likely made a good deal of money doing it. While the noise in the media and economy has been deafening (it always is though), you would have been mindlessly adding to strong trending positions and taking new entry signals as your system generates them. You would have been seeking out strong performing companies with continually improving stock prices and charts.

While I showed the scary look of the broad market in the Top Down section, even this week with the SP500 down nearly 1%, we have two new signals for our blog portfolio to take and the setups are very solid in terms of risk/reward. Here is what our Bottom Up approach came up with this week:

Entering Time Warner (TWX)
After rallying strongly for the better part of 2 years, TWX has spent the last 8 months moving sideways, consolidating those gains. Recently price has been bumping against this upper resistance boundary near $71, this week we decisively broke through. The risk is very nicely defined here as the prior swing low at $67.50 can act as our stop. A failure of that low would suggest the breakout has failed and more consolidation is needed. For longer-term investors, you could use the lows at $62.50 as a wider stop. Either way this sets up nicely. Now take a look at the long term picture here for some added risk/reward perspective.

While the rally over the past 2 years has been "too far too fast" for many, a little added perspective here shows that prices are still well below the mania levels of 1999. The near term rally paused as soon as it made a higher recovery high back in mid 2013 and has since traded sideways using the prior high level as support. Now we are seeing lift off above all those highs and it appears the rally will continue. It may never get back to those lofty valuations of the dot com bubble, but even it it gets half way there we could easily double our money. When I can risk $6 for a potential reward of $70+, I get a little bit excited.

Again a move below $65 and especially $62 would negate this thesis and we would want to await further direction before proceeding.

Entering International Paper (IP)
I have been watching IP for what feels like years now. This thing has traded perfectly sideways for over 18 months. The most maddening thing is that it has done this while the broad market has been repeatedly making new highs. As you can see from the Relative trend, IP has been underperforming for nearly all of 2013 and thus far in 2014. However the last two weeks have shown that maybe the rotation is finding its way to this once loved stock. We saw a breakout of price last week but the Relative Strength hadn't confirmed the breakout until this week's action. I would now expect the uptrend to resume following this move to new highs as well as the recent shift in investor funds into the stock. Initial stops can be placed below the rising 20 WMA which would also coincide with a failed breakout signal. Below the breakout and especially below $46.50 I would want to be very cautious of this area, but above this breakout level, the sky's the limit.


It's not that one method of analysis is right and the other is wrong. These methods simply appeal to different individual mindsets and they both have their place in any investment style. I will say however that on the whole, Bottom Up investors have the much stronger track record than someone who simply focuses on the macro view of the market and economy. Legendary investors like Warren Buffett and Peter Lynch utilize a Bottom Up approach where they believe that buying the strong companies is more important than guessing what the overall economy and market will do. This is where Relative Strength investing really separates itself from the other strategies in my opinion. The very idea of relative strength is that the individual stock will perform better than the overall market. So if you have a stock that is beating the market (we have lots!), then why would you sell that stock when the overall market got weakened? Isn't the reason you are in the stock is because its performing better than the market? If it continues to do so, we need to give it the benefit of the doubt. Its strong for a reason and until its not, we want to stick with it.

When things finally turn bad out there we will be stopped out of our holdings, it will happen at some point. But instead of worrying about when that will be, just wait for your individual stocks tell you so.


It's Tough to Sell

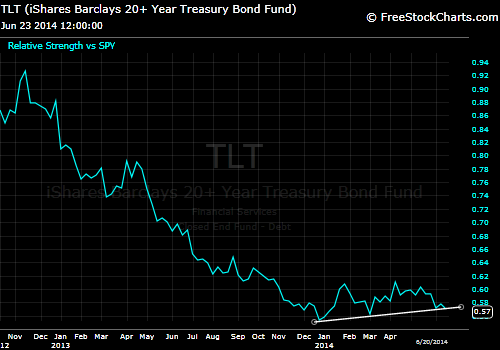
Everyone has a way of buying into a stock; they have a tip, or some inside information on the company, or the stock just made a new high, etc. It's really easy to buy a stock. You just pick the one you want and usually you can find a reason to justify the purchase. The hard part is, when do we sell it? Because thats really the defining point of the trade; the sell point determines how much you made or lost on the initial purchase. While there is no right or wrong way to sell a stock exactly, there are simply ways of reducing risk when certain criteria are achieved. Also just because the criteria is present doesn't mean you will be absolutely correct on your timing. Take our current TLT position for example. Last week we received a warning signal from our Relative Strength trend indicator that suggested that the risk of a sell-off in bonds was now a higher likelihood than previously thought. Now looking back on this week's trading it would appear that the signal for caution was false, mostly.

Prices for Bonds rallied strongly this week, as well as the Relative trend vs. stocks. But I don't think this signal has been proven completely false yet. The price action still shows a lower swing high compared to the  recent peak a few weeks ago. The Relative Strength also shows a rally back to retest the underside of the broken support. What it will take to prove our exit signal false would be to see that RS trend continue back through the trend line to regain the uptrend AND for price to breakout and close above the prior swing highs around $114.50. A move above that and I would be inclined to dramatically increase my TLT exposure again. But short of that scenario occurring, right now its a wait and watch situation. I will continue to hold a half position until price and trend verify that the rally is over. A trade through $110 is still that key level.

The main takeaway is that being able to sell at the exact peak is very unlikely and should not be attempted without valid exit signals. You will not always be right. In fact sometimes you will end up selling at the exact lows and then will have to watch the stock move right back in the prior direction. Look at CMI as a perfect example of this.
There was a clear sell signal in early 2014 when the stock sliced through the 20 WMA and the prior support lows. There also was a clear violation of the RS trend support. We stuck to our plan and reduced risk when the signals suggested it, but within 3 weeks we had received a new buy signal; we added right back when the signals changed higher for the better. The ongoing result should be obvious by simply looking at the chart, price has continued higher steadily.

Some signals will be false, that's just part of the deal. Our job does not require us to guess which signals will work out and which won't. But we are required to take each signal without question because the system picks winners over the long-term. Our success is dependant on those few signals that turn into massive winners, those big wins pay for the many small fake-outs the market sends our way.

Once you find a way to determine when risk becomes elevated you need to act consistently and decisively. If for some reason your signal was wrong, simply adjust right back with the changing conditions. But when your signal is right, it will be really right. As famous investor George Soros once said, "its not about being right or wrong. It's about how much you make when you are right and how little you lose when you are wrong."

This is what sets apart the winners from the losers. Winners make a lot when their signals are right and only lose a minimal amount when they are wrong. Losers do the exact opposite, they lose big and win small.

I'm not sure about you, but I'm here to win.


Sunday, July 6, 2014

Stepping Up Our Game

I believe a key factor to success is to push yourself and challenge your ability to learn something new. For the past 5 years I have taught myself the markets, how to study price action, risk management, emotional discipline. During this time I have grown significantly as an investor and I strongly believe that my hard work has been paying off. There is always more to learn though and to challenge myself further. That being the case, a new challenge for me and you has been thrown down.

The Blog Portfolio will be receiving a new inflow of funds and therefore it is time to step up our game. For the past 18-months I have shared my adventures in the stock market. While I use this space to journal much of my investment thoughts, I have also hoped to help teach others who may be interested in managing their own money. We have followed a 10 stock watchlist and have allocated our funds toward that specific universe of stocks. However with this recent improvement of account equity we are going to need to expand our universe of available stocks to choose from, as a 10 stock maximum concentration puts too high of an exposure to any one particular stock. 10 was a small amount of individual names to learn and follow, but over the past 18-months I am sure you have learned to expand your watchlists as the new opportunities are much more plentiful. We will now be shifting to a 90 stock universe, the SP500 Sector Top Ten stocks. Each of the 9 S&P major sector groups are represented by the XLF (Financials), XLY (Discretionary), XLK (Technology), XLI (Industrials), XLB (Materials), XLE (Energy), XLP (Staples), XLU (Utilities). Each of these individual Sectors have a Top 10 Holdings made of the best 10 large-cap stocks in each group. Some of the names may change each year but the core typically stays the same. Names like Union Pacific Railroad (UNP), Wells Fargo Bank (WFC), Procter and Gamble (PG), and Gilead Sciences (GILD), are some of the key stocks we will be looking at going forward.

For your reference and Watchlist, here are the 90 stocks we will be tracking as we continue:

XLF                                                                           XLY
Wells Fargo (WFC)                                                    Comcast (CMSCA)
Bank of America (BAC)                                              20th Century Fox (FOXA)
JP Morgan Chase (JPM)                                             Time Warner (TWX)
Goldman Saks (GS)                                                     Ford (F)
Citi Bank (C)                                                               Home Depot (HD)
Morgan Stanley (MS)                                                  Walt Disney (DIS)
US Bank (USB)                                                          McDonalds (MCD)
Berkshire Hathaway (BRKB)                                      Nike (NKE)
American Express (AMX)                                           Starbucks (SBUX)
Met Life (MET)                                                          Amazon (AMZN)


XLK                                                                          XLI
Intel (INTC)                                                               Caterpillar (CAT)
Apple (AAPL)                                                            General Electric (GE)
IBM (IBM)                                                                 Union Pacific Railroad (UNP)
AT&T (T)                                                                   Cummins Engines (CMI)*
Oracle (ORCL)                                                           Boeing (BA)
3D Systems (DDD)*                                                   United Technologies (UTX)
Verizon (VZ)                                                               3M (MMM)
Qualcomm (QCOM)                                                   Emerson Electric (EMR)
Microsoft (MSFT)                                                       Honeywell (HON)
Google (GOOG)                                                         UPS (UPS)

 XLB                                                                           XLE
Freeport McMoran (FCX)                                          Chevron (CVX)
LyondellBasell Industries (LYB)                                   Conocophillips (COP)
Dow Chemical (DOW)                                                Apache (APA)
International Paper (IP)                                                Exxon Mobile (XOM)
Nucor (NUE)*                                                            Occidental Petroleum (OXY)
Monsanto (MON)                                                       Anadarko (APC)
Air Products & Chemicals (APD)                                Halliburton (HAL)
DuPont (DD)                                                               Schlumberger (SLB)  
PPG (PPG)                                                                 EOG Resources (EOG)
EcoLabs (ECL)                                                           Enbridge (ENB)*

XLP                                                                            XLV
CVS Caremark (CVS)                                                United Healthcare (UNH)
WalMart (WMT)                                                         Pfizer (PFE)
Phillip Morris (PM)                                                      Express Scripts (ESRX)
Altria (MO)                                                                 Medtronic (MDT)
Pepsi Co (PEP)                                                           Abbott Labs (ABT)*
Costco (COST)                                                          Merck (MRK)
Procter and Gamble (PG)                                            Johnson and Johnson (JNJ)
Hain Celestial Group (HAIN)*                                      Amgen (AMGN)
Coca Cola (KO)                                                         Bristol-Meyers Squibb (BMY)
Colgate-Palmolive (CL)                                               Gilead Sciences (GILD)

XLU
American Electric Power (AEP)
PG & E Corp (PCG)
Exelon (EXC)
PPL Corp (PPL)
Con Edison (ED)
Duke Energy (DUK)
Southern Company (SO)
Sempra Energy (SRE)
Next Era Energy (NEE)
Dominion (D)

* stock not included in the actual Sector ETF. They are individual selections made at my discretion.

So thats a lot more to follow than 10, but its time to take this to the next level. This is the watchlist I regularly use and if you are going to be a relative performance investor, you will need a more broad mix of the actual assets moving the markets. The way I manage my other accounts is I take signals generated by my trade plan (as we do with our Top 10) from this more broad mix of stocks. I focus on these stocks as they are the best and biggest of the best and biggest. The SP500 is made up of 500 total stocks, so our list still omits most of the stocks in that index and only focuses on the top 20% of companies.

The open management of trades will be similar to what you are already used to, with a few slight changes. For example, instead of splitting buy signals up into 3 increments, I simply use the 20 WMA breakout signal coinciding with the Relative Strength trend shift to enter a position. The position size and trade management is determined using the "R" metric I discussed here.

If this feels overwhelming to you then you can choose to pick a few of these to add to your current list of 10 and ease yourself in. But I base all of my weekly research off of these 90 stocks and will be sharing information relevant to them all. Again, to grow as an investor you will need to push your comfort zone a bit and get a more full view of the market place. That is what I will be working to help you with. You have made it through the beginner stage and now its time to move to a more intermediate level. For me this will be a big opportunity to manage money the way I believe is necessary to have strong success in the markets. We will be buying winning stocks in uptrends just as before and will be focusing on risk management as our #1 priority.

Warren Buffett has two rules for managing other people's money:
Rule #1. Don't lose your investor's money
Rule #2. See rule #1


With that being said, lets look at this week's Portfolio additions and subtractions.

-Reducing TLT position by half on RS trend failure
Treasury Bonds have been in a Relative Uptrend vs. the SP500 since the beginning of 2014 but now have created a lower low in the trend and broken the uptrend. Price was just able to hold above the 20 WMA and is sitting on our stop level. We will take half of our TLT exposure off and will await further direction.

Another continued move lower from here will likely see our remaining position sold, while a breakout above the $114 swing high would suggest more upside to come. We will see where this goes next. The last time TLT broke its uptrend and issued a sell signal, stocks rallied for from May through December of 2013. So while its not looking the best for the bonds space, stocks could be ready to run again.

-Reducing AEP for RS trend failure
We also received a failed RS trend in our Utility leader AEP this week. The price action is still intact here above the all-time high resistance level, uptrend support and 20 WMA. But Strength is beginning to weaken and it makes sense that Utilities would struggle at the same time as bonds as they are interest rate sensitive. With the strong jobs data reported Thursday morning, rates bounced as they would if the economy were turning a corner. I think a reduction of 1/3 of positions makes sense here. We want to be in this stock while its in breakout mode, but if its going to lag the market in any way, as the RS may suggest, it is prudent that we take some risk averse positioning.


+Entering Gilead Sciences (GILD)
As is consistent with this week's theme of selling defensive and buying offensive groups, GILD makes its way into our Portfolio. Gilead is a leading biotech company who has displayed strong growth and increasing investor support. After recently consolidating its substantial uptrend, prices seem to be resuming in the prior direction with this week's strong breakout. The price action has the look of a rounded Cup/Handle formation and this continuation pattern targets prices near $110. That would be our first target on entry and we will place our initial stop just below the recent swing low from last month. A break of that low and a failure of the rising 20 WMA would be enough to signal a failed breakout attempt. We will call it $77 for now. Above $77 though this looks like a continued winner.

+Entering Freeport McMoran (FCX) 
FCX has been in a steady downtrending market for several years now, that was until this week's move above the prior swing high that has invalidated the downtrend. This is a great setup as the upside could be fantastic compared to the initial risk of entry. The stock has declined over 50% from its highs back in 2011 and therefore we could see a potential 100% move to the upside if it wishes to revisit those prior levels. The support base is strong and initial stops will be placed below the breakout swing low and rising 20 WMA at $33.50.

That is a pretty wide stop so don't be surprised if the position size is smaller than usual at first. The beauty of a setup like this though is that as our stops trail the price higher we will have plenty of room to increase our position size should the trend continue to move in our favor. If it fails quickly we will take a small loss and move on. If this turns into a major bottom, the upside could be huge.


--Changes to be implemented from this point forward:

1. Stock universe to expand to 90 stocks, from 10 previously
2. Positions will be entered based on 20 WMA/RS breakout signal
3. Position size and trade management will be based on "R" metric
4. To reduce whipsaw situations from largely impacting our portfolio we will limit new portfolio additions to a maximum of two new positions per week.
5. Due to the potentially increased number of open positions at one time, the initial R will be set at .5R. Meaning we will be willing to initially risk .5% of our total equity value on each new position.

Tuesday, July 1, 2014

Do You Understand Your "R"?

"R"isk is the single most important factor YOU CAN CONTROL in the marketplace. Once you enter a position, you are at the mercy of the market to prove that idea right or wrong. We simply have no control over what the market does with our money once we put it on the line, but what we do have control of is (roughly) how much we are willing to lose if this idea happens to be wrong.

In investment lingo we call this notion "R". R is risk, R determines how much of a asset you can own and it determines when that situation is moving outside of your comfort zone. Knowing what R means is one thing, putting it into practice is another.

Quite simply R is the amount of money (in dollars) you are willing to risk on a bet. The way we derive this number depends entirely on you and your individual risk tolerance. For the sake of discussion we will use the risk parameters I set for my own trading systems, which is 1R or 1% of my total portfolio value. I am willing to risk 1% of my trading capital on any one position. That ensures that even if I suffer a string of losing trades, I will still have substantial equity to continue my positive expectancy trade plan. Lets assume your investing account is worth $10,000. 1% of 10,000 is 100. So if you put into practice a 1R risk level, you are willing to risk $100 on any one trade.

Next lets use this risk amount to determine how much of a stock we can buy in one sitting. If we can lose $100 on the trade and be within our predetermined risk tolerance, you need to figure out how many shares of the stock you can own while only risking $100. Lets say you want to buy Verizon (VZ), VZ currently trades near $50.

The first thing we want to do is look on the chart where the major support is and where your trade will be proven too high risk. At a glance, the $46 level looks like the major support. So we have our entry price $50 and we have our key support (stop) at $46. The way we calculate risk is to take the difference of our entry price 50 and the stop level 46, that equals 4. We risk $4 per share if we buy VZ with this method.

Now we know that we can stand to lose $100 per trade and with our entry here we can lose $4 per share. So we divide 100/4 and get 25. We can buy 25 shares @ $50 per share with a stop at $46 and be within our 1R risk preference.

Trade Re-balance
Once we know how to determine our R, we can assess risk at any point during our trade. An idea that was presented to me some time ago was the idea of maintaining proper balance of your portfolio using your R amount. This is called Open Equity Risk. Lets say for the sake of argument that after our VZ entry that the stock surprisingly jumps to $55 very quickly. Trailing stops and moving averages tend to lag the current price action and have a hard time adjusting to such a quick, violent move. That leaves us in a slightly uncomfortable position in that you have a trade with a dramatically higher price and your stop is still in its initial place. What was once a 1R risk from 50 to 46 is now stretched over 2R from 55 to 46.

We can determine if we want to continue the trade untouched and let it just ride, or we can see how our risk has changed with this recently changed environment. We are going to figure our risk exactly like we did originally but with the new range of price. The difference of 55 (current price) and 46 (stop) is 9. If we have 25 shares with $9 per share risk we now have a total open risk of 9x25= $225. We had previously determined that we could risk $100 as our 1R figure on any trade, and while technically we still risk that original $100 amount, we now have a new situation to deal with. If the market where to move against us from here and stop our trade out, we would have lost $225.

This idea is what is known as Open Market Risk and is a topic of some debate. Whether you choose to continue to hold the position as is or you reduce your holding size to account for the risk is a personal preference. The way you would bring your portfolio back into balance of 1R would be to simply determine how many shares you could own at $55 with a stop at $46 where you are only risking $100. $9 is our difference between current prices and the stop and 100/9 is 11. Therefore you could own 11 shares to be within your 1R, so you would sell 14 shares at the current price. This way, you can book the gain, maintain a position in the uptrend and keep your portfolio and trade within your risk tolerance.

Adding to Positions
I use R all the time in my trading, one place in particular is when I have a new Add signal for a current holding. Once a stock triggers a new Buy signal based on my system, I determine the stop placement after the breakout and figure my R based on the breakout price and the new stop price.

Lets look at a trade in motion currently: I have eyes to add to ECL if the breakout early this week can carry into the weekly close Thursday (Friday is the 4th of July).

 With this potential breakout this week, it looks like I will be able to trail my stops up to the swing low just above $106. We will assume for this example that price closes around this $111.60 area and we will use that as an initial level to determine the current open risk we would have in the position.

With current prices at 111.60 and the expected stop to be about 106 that leaves us with 5.60 as the amount per share that is currently at risk; I currently hold 37 shares of ECL.

5.60 risk per share multiplied by 37 shares equals $207 of total open risk. Now the 1R on this particular account is $400 so it would appear that I am under-invested based on a 1R risk guideline. Therefore I can add to the position on a confirmed signal, up to a $400 total risk or roughly double my current holding size.

As a side note: I rarely would double the size of a current holding for a continuation signal. Most likely I would add half again as much and just be content to have a slightly less risky position. Just because you set a 1R limit on your risk doesn't mean you have to push that limit on every position. Sometimes it is best to simply hold a .5R, but in a situation where the stock is acting right and generating a new signal, that is where I look to take advantage of a lower risk situation and increase my exposure.


--With that little lesson, you should have a good feel for how to keep your risk in some way organized. That is THE key to this whole game. If you can keep your risk in control, your profits will take care of themselves (provided you don't attempt to sabotage yourself by taking premature gains too soon). Understanding how much you can risk will keep you playing and learning without seriously jeopardizing your long-term plans. Always know your stops, keep a balanced portfolio where excess risk isn't lopsided, and continue to calculate your R and you will be on your way to success. 

Saturday, June 28, 2014

A Look Around the Market

It was a modest week for the market and we had no changes to our Portfolio, but there are some interesting things going on under the radar.

Is Consumer Discretionary about to make a comeback?

A major talking point for the bearish case of the market has been the relative weakness of Consumer Discretionary stocks (XLY). Typically in a strong, healthy market, the Consumer Discretionary sector tends to be a relative leader signalling a strong economy. When they lag it says that consumers are buying less and therefore the economic activity is slowing...The market HATES slowing! 

We have seen the XLY lag for the better part of 2014, but is all lost? Can it not turn around and rotate back into a leading group? Many of the key sector stocks have pulled back nicely from their highs and have built solid support bases to extend another leg higher. If the market is to extend its rally, Discretionary stocks are going to need to participate. 

Just taking a quick glance at the leading XLY sector stocks will show some very bullish activity. It appears that XLY wishes to participate here and may have a nice move coming. 

XLY 
XLY has been consolidating the big gains of last year by trading sideways through time. Remember prices can correct two ways, through lower prices or time. The most bullish scenario is when an price trades sideways after a big rally. This shows tight supply of stock at all time highs; it means current holders don't wish to sell and new buyers have to pay higher prices if they want in. That eventually causes a resumption of the prevailing trend. A weekly close above $67.40 would signal that the Discretionary sector is ready to continue higher. 

We are already seeing this breakout action in many of the top XLY stocks. When you see individual names start to lead the breakout, there is a very high probability that the broader group will follow. What you want to do is pick out the names leading the breakout and focus on them. Lets take a look at a few names I think are set up strongly for another move higher. 


Starbucks (SBUX)
This looks like a solid 5-wave sequence and it would seem that price has just completed wave-4 with this week's higher high. The 5th wave tends to be the most violent wave; you can make a lot of money in the last 3rd of a bull market. We could be looking at that right here. 


Zooming in on the recent rally and correction it appeared that price was playing out a long-term bearish head and shoulder top formation. Starbucks' stock broke below its support neckline in early April but saw no further downside follow through. That creates a false breakdown and traps all the short sellers as price rallied back above the support level. There are likely a lot of people caught out of position here as they were sidelined or betting on this "top" forming event. The breakout this week above the right shoulder high almost completely kills the pattern's odds of success. From false moves come fast ones in the opposite direction. 

Not only has the market fooled the over-aggressive in this space, but a new buy signal has also triggered. We can see that the 20 WMA has stopped declining and turned higher this week, thats sign #1. We also saw price take out the prior swing high in the downtrend and was confirmed by a Relative Strength breakout, showing money is rotating into SBUX. 

I would expect an increased probability of higher prices in the future, but in case this doesn't go to plan and the breakout here were to fail, I would exit positions below the $70 level as that would suggest more consolidation was needed. Above $70 and especially above $77, I like SBUX's chances going forward. 


Walt Disney (DIS) 
Shares of Disney are trading at new all time highs on strong trading volume again this week. When looking for a hint as to whether a sector can breakout to new highs, its a good idea to see how many underlying stocks are themselves making new highs. Seeing Disney lead here is a good sign for Discretionary stocks moving forward. 


There are more examples to be seen in the Discretionary space: our Portfolio recently took a new buy signal in shares of Ford, Comcast looks to be moving above its new support base, both TWX and FOXA are trading at the upper end of their ranges and are probing multi-year highs. The list goes on. 

I looks to me like the Discretionary space wants to push higher from here and I want to be positioned in the strongest names in the group. The risk/reward appears favorable after the recent consolidation and this could be an interesting rotating sector in the coming quarter or more. 

After a super rally, Energy stocks are extended

With all the news out of Iraq, oil prices have been rising, carrying many leading oil/gas stocks along with it. Some of the markets best year-to-date leaders have been energy stocks, stocks like EOG, SLB, COP. These names and many others are showing signals of intermediate "blow-off" surges. While long-term I feel the Energy sector is on strong footing, at this moment it is likely not favorable to be a buyer. 

EOG Resources  
EOG is one of my personal favorites in terms of price performance and its easy to see why. For a couple years now EOG has moved significantly higher, but has recently seen an escalation in its uptrend slope that appears unsustainable in the short term. Once price goes vertical the stability of the trend degrades and volatility usually expands, creating more risk. I think a pullback to at least $103-$96 is in this stock's near future. 

Schlumberger (SLB)  
Just like EOG, SLB has been a strong performer for the last year and has recently made a parabolic move to the upside. Again, long-term I love this space, but short-term warning bells are ringing. 

Conoco (COP) 
The move in Conoco has been unreal. 17 of the last 19 weeks have been positive, the stock has literally gone straight up 5 months in a row. While that is incredible price action, moves like that will need to correct at some point. The problem with trying to buy a stock like this is you have no idea where you are wrong. There is simply zero support for at least 15% below current prices. In my experience a move like this is not sustainable for too long. Be patient here.   


Utilities have bases for days!

Boring old Utilities look like one of the best long-term sectors in terms of value and price action in the market currently. There are base breakouts taking place that could present some serious long-term opportunity for portfolios. 

Stocks like American Electric Power (AEP), PPL Corp (PPL) and PG&E Corp (PCG) are showing very interesting support base formations and could be poised for multi-year runs. 

AEP
Readers here know how much I like AEP, it is currently one of the Portfolio's largest holdings. While I would expect some consolidation in the near future, you have to be pleased with the follow through above the all time highs resistance going back almost 20 years. 

PPL
PPL has always been on my radar, likely due to its relatively cheap valuation and high dividend yield (currently 4.3%). While it has seemed moderately appealing I did want more out of the stock in terms of higher highs and finally it seems we are seeing them. The recent breakout suggests prices want to move significantly higher from here. 


PG&E Corp (PCG)
Coiling at all time highs, PCG has the look of a stock that will resolve to the upside. After the monster rally from 2003-2007 prices have churned in a roughly $10 range. A breakout above the triangle resistance would set up a nice long-term position entry. While looking solid here, the 3.8% dividend payout is not too shabby either.


There are some interestings things going on out there that many are not talking about. If you listen to the media you will hear that Discretionary is dead, Energy is a strong buy and don't even think they will waste air time discussing Utilities. I have found listening to the financial media creates more contrarian ideas than anything else. If CNBC says something is a strong buy, the move is likely already over. If they leave a sector for dead it often means its just getting ready to rally. Its almost uncanny how bad they are at making investment advice. But if you use your eyes its pretty easy to see where the value is in the markets. Just observe the price action and that will lead you to the right conclusions.

Chart of the Week 

3D Systems (DDD)

We've been watching DDD for several weeks now as it has been likely trying to put in a bottom of some kind. It has traded sideways for 12 weeks and prices have begun to turn back higher. This week DDD broke back above its 20 WMA, however the average is still currently declining. We want to see the 20 WMA turn higher as prices continue to make higher lows. Stops for aggressive long positions here should now be at trend support and the lows at ~$50. A break below $50 would make a new low and we would want to see that area hold on any sort of test. Above that level I think DDD looks pretty interesting. 


Monday, June 23, 2014

New Highs

Markets continued to new highs again this week. This is a good thing folks, a lot of investors fear new highs for some reason. While it is true eventually a new all time high will become THE TOP, the odds favor continued new highs to build off the prior highs. The trend has a way of persisting much longer than anyone can deem reasonable. For this reason alone we shouldn't be attempting to guess where the end of this will be. Instead we should be continuing to take our signals consistent with strong bull market behavior.

Your trade system will go through periods of good fortune and bad, the important thing is to be able to identify those times and press when trade success is high and withdraw when it is not. When your trades are working, you are in a favorable environment for your system and you need to be sure to capitalize on those streaks. You need to have a simple way of identifying when the market is favorable to your particular strategy. My strategy performs best during trending markets, either up or down. My strategy struggles in choppy and range bound markets. That being the case I need to have a way to determine if the overall environment is favorable or not. The way I do this is to simply place the SP500 against its long-term trend averages. I look for a signal that tells me if the market is likely headed higher, I encourage you to do your own research to identify your specific parameters for being in the market or not.

SP500 monthly bars

Here's a zoomed in view of the current rally and bull market:

The parameters I set for my long-term Bull/Bear thesis are the Simple 20 Month Moving Average, a 2.0 Volatility Stop and an uptrend support with at least 3 touches of the trend line. For a defined Bearish signal to be generated I need to see all 3 of these signals fail (currently for this to occur the market would need to break below 1,700ish). At that time it would be best to avoid stocks until the signal reversed and suggested elevated risk has lessened.

As you can see, my basic market gauge suggests that we are still well within the long term uptrend and bull market. That being the case the market is favorable for my particular trend strategy and I am still looking for new setups aggressively. When conditions shift, I will become more defensive and less interested in putting extra cash to work.

Continue to take your signals that are in sympathy with an uptrending market. Don't worry about what the news says and don't be too eager to pick the top of this market. Most investors think the only risk present in the market is for stocks to correct lower. However one of the most costly risks to investors is not taking advantage of strong markets and missing the majority of an upward move. They are so fearful of a crash from the highs that they fail to invest accordingly to the current environment. Emotional investors tend to sell too early and buy too soon into declines. We are taught that we should buy low and sell high, the problem is that theory supposes one can identify tops and can time bottoms. Most simply cannot do that, yet there are those who have lost quite a bit trying to do just that, going on several years now. Don't be one of those investors that gets so wrapped up in a story that they fail to see what's happening right in front of their eyes. If the market is going up you want to be heavy in stocks. If the market is going down you want to reduce exposure and play defense. Get your money in when you have the best odds and protect it when you don't, don't give anything away. The name of this game is to keep risk as small as possible while keeping returns as high as possible. The way you do this is to ride winners as long as the uptrend is valid and cut losing positions early and aggressively.

We had no changes to our portfolio this week and most holdings moved to higher prices. There are two items of note heading into next week:

TLT
I'm a big fan of ratio analysis (Relative Strength), I believe knowing how money is flowing in and out of a particular asset vs the general market (or any other asset) can help identify significant trend shifts. When money flows into a stock, the stock goes up. When money flows out, it goes down. It's a pretty simple concept and can help your returns dramatically. It is difficult to identify the importance of one particular bounce in ratio analysis, but identifying a trend can be more easily managed. That being the case I watch for trend shifts in Relative Strength at all times...

 After bouncing nicely last week off the current RS trend support, TLT vs SP500 (TLT:SPY) rolled back down into the support area again. I will be watching for a break of the uptrend and a move below .56 to invalidate the Relative Strength. That move would also prompt me to reduce some of my TLT exposure going forward.

PPG
The PPG:SPY ratio trend has poked through the long term uptrend support this week. With a price trend as strong as PPG has had I am willing to see a little more before I hit the eject button. I want to see a confirmed break of the trend AND a break of the prior support lows here at 1.04. A ratio of 1.03 would be enough to invalidate the uptrend and cause me to reduce some exposure to PPG.


Chart Of The Week

Intel (INTC) Monthly bars
 Intel has been a grinding, choppy, sideways stock for more than 10 years. Conservative investors loved it for its steady and increasing dividend payout, yet traders ignored it due to its lack of real momentum in any direction. Something is changing however, we have seen a breakout of a resistance level that has held since the early 2000's. Is INTC about to relive its glory days? I think the odds of higher prices from here are high and think you could do well adding this strong 4% yielder to any portfolio. INTC has been mostly dead money since the turn of the millennia, that time could be at an end.

There is a common phrase that technical traders like to use, "The bigger the base, the higher the move in space". A consolidation of this nature can create quite a supply/demand shift as left out participants will be scrambling to get a hold of some shares. The beauty of a base this long is that while the recent rally has been strong, there are still many out there who will not believe in this setup for a long time to come. The sideways movement frustrates both long-term investors and shorter-term traders in that no real trend develops and their initial investment made 10-15 years ago is worth the same now as it was then.

 There is another common saying that states, "if a consolidation doesn't shake you out, it will wear you out". I believe many are worn out here by Intel. The interesting thing I have noticed anecdotally when asking people about INTC is that they blow it off as being "boring" or "dead money", I have to put myself in that category as well, up until last week I thought similarly. But things change and we have to change with them. I do still believe that INTC below this breakout level is likely dead money, but above it...oh boy, this thing could be headed way higher! Most investors have a hard time buying a stock when its been up, but that is one major reason why most investors fail to make money. This may have moved a bit since the 2013 lows, but relative to its historic pricing there is plenty of upside potential.

This assessment would become invalidated below $25.50. Above that, there appears to be lots of open air. 

Saturday, June 14, 2014

Know Your Levels

Don't fret, don't fear, don't stress. Some things are simply out of your control so don't bother yourself trying to control them. For all you control freaks out there you are simply going to have to improve that part of yourself if you want to manage your own money successfully.

So what's happening this week that has everyone so worried? Well it appears that tensions are rising in Iraq again as radical insurgents are taking over many Iraqi held cities. President Obama has discussed the possibility of providing some "help" against this invasion. What does this mean for the stock market? Potentially a fear inducing panic, possibly the end of the bull market, possibly just a buy-able pullback. Simply put we don't know what it means for the markets, the US or our portfolios.

Since we can't know the future, what can we do about it, really? We can drive ourselves crazy and start to invest on the whims of news headlines out of Washington, or we can maintain our focus on what we can control which would be at what levels our current trades are proved invalidated. We want to dig out our "lines in the sand" charts again and see where we will no longer be in breakout mode and where we will need to switch to a more defensive positioning.

To begin this exercise let's line up our two primary market indexes, the SP500 and the Russell 2000. This will give us a good view of the broad market watching both the large and small cap stocks.

SP500 Daily chart

 By just glancing at the the SP500 you can see we are still above the prior resistance levels and are in breakout territory. The first warning signal will come from the prior resistance area failing to hold as support on any retest. For the sake of simplicity we are going to call anything above 1,900 full speed ahead. There will be no need to touch anything as long as the market is above 1,900. The most recent swing low on both the weekly and daily charts is 1,870. That should act as a strong support and I would expect a healthy market to not fall below that level. After that 1,815 would be a full trend invalidation point and set a lower low. So regardless of Iraq, Washington, or the economic data, the levels to watch are:

1,900 = Full bullish mode
1,870 = Swing low and significant support
1,815 = Trend invalidation for the uptrend, major higher low in long term uptrend


Russell 2000 Weekly chart

The Russell small caps is a bit more messy in that it hasn't yet made a new high along with the other market indexes. It is still showing longer term relative weakness and really the only two points we care about are the prior all-time highs at 1,212 and the major support at 1,100. Between those two points, the Russell 2000 is pretty much in no man's land and until a move comes above or below those levels we don't have too much to think about.

1,212 = Prior all-time highs, full bull mode above those highs
1,100 = Long term trend support, below this there is big trouble ahead.  


Aren't you glad you have spent the last few days chewing your fingernails down to the nubs?! I just took all the anxiety out of the market in two paragraphs. This is how you need to think in order to manage your's and other people's money. You need to be cold and calculated in your risk assessment. There is ZERO place for fear and emotional reactions to news events in the markets, everything can be broken down to simple levels of risk management.

Lets zip over our current holdings (7 out of 10 watch list stocks we currently hold) in a similar manner to determine where those key levels are for our holdings.

In order of total position size:

TLT
For being in a situation where Bonds could easily fail, TLT couldn't even get a trade below $111 this week. This was impressive to me seeing that kind of demand still after the recent 6-month rally. The story is still the same as last week but we did see the RS trend bounce nicely off of trend support and that provides some clue as to the continued strength in TLT. We want to maintain our exposure to TLT as long as price is above $110 and the RS trend is above trend support.

WFC
WFC continues to trade at all-time highs. Some could say that this week's action (making a new high but closing below last week's high) could be signaling a top for prices. But we don't try to pick tops here and would need to see some significant and sustained downside pressure to shake our resolve. Above the 18-month uptrend support WFC is good to go. Stops would come into play near the $48 area.

PPG
PPG continues to make all-time highs and is in full breakout mode. RS trend support is intact as is the price uptrend. We want to hold PPG above about $195 which would have to break both the uptrend support and rising 20 WMA.

AEP
After being smacked down early in the week, AEP once again found strong buyers near the $51 area. This has been a recurring theme as there seems to be a solid support base forming at the prior all-time highs. Above trend support, the rising 20 WMA and the breakout inflection level (green line), this is still a stock to own going forward. Stops should be just below $51.

F
Ford is getting off to a bit of a rocky start after announcing some adjustments to many of their top new models' fuel economy numbers. These headlines, while notable, should be kept on the sidelines from your assessment of the strength of Ford's stock price. As long as shares can hold above the $15.50 swing low and rising 20 WMA we will want to defer to the uptrend.

CMI
CMI moved to a new high this week and still seems to be headed toward our $164 base target. A pullback here would make sense, but as long as price can stay above $146 I feel the trend is intact and healthy. We will need to watch the 20 WMA and current RS breakout for prolonged trend health, but above these levels we will stay the course.

UNH
Nothing new to say here. Above the $75 swing low, we are staying with UNH.


Investing your own money doesn't have to be stressful, emotional, or difficult. By simply applying some basic supply and demand principles along with buying stocks that are going up, you can do better than 95% of investors out there. There is nothing magical about trading the markets. There are no perfect systems or crystal balls telling the future. All you need is a simple understanding of how markets move and assess your "lines in the sand" for risk management purposes.

Once you have your stops in place you are either in the stock above the line or out of it below the line. Nothing earth shattering here, just simple risk management. There is no reason to agonise over whether to buy or to sell, just stick to your stops. Buy breakouts to new highs and sell breakdowns to new lows. No need to get more complicated than that, buy stocks going up and sell stocks going down. News events should not alter your levels, nor should any outside opinion. Your levels are YOUR levels and they are determined while the markets are closed and away from the heat of battle.  


Chart of the Week


Russell 2000 weekly chart
I realize I just said above that nothing was really important with the Russell 2000 between the key highs and lows. But just to show what is happening within the range I have zoomed in on the action. There are a couple things that suggest an increased probability for higher prices from here:

1. The R2K has moved back above the 20 WMA and this week we saw the slope of the 20 WMA begin to turn up. That, along with a new 50 day high in prices is a Buy signal based on my trend system.

2. The RS trend vs the SP500 recently failed long-term support yet was unable to sustain further downside follow through. The RS then managed to regain its territory above the support creating a false breakdown and can be a major catalyst for a rally.

While these events don't guarantee higher prices ahead, they are prerequisites that all significant rallies are built upon. Because we can't see the future we need to look for signals that increase our probabilities for success. The fact that the Russell is showing this pattern here has to be taken as a positive going forward.

As long as 1,100 holds as support there is not much to fear in this space or the market in general.


Sunday, June 8, 2014

Confounding the Masses

Over the past two weeks we have seen the markets push higher with the large-cap groups once again setting new all-time highs. In my scans I am seeing many new setups breaking out and now the number of SP500 Sector stocks that are above their rising 20 WMA's is at a level that suggests broadening participation at these new market highs. We like to see more stocks in uptrends and making higher highs while the market does so as well. The more stocks acting well, the stronger the underlying market health is, which suggests a more sustainable rally.

The SP500 has made a strong move away from the prior nearly 6-month trading range and looks to have more upside to come in the intermediate term. There are a lot of people saying the market is overbought here and extended. These are the same people that were saying a month ago that this market was so unhealthy it was likely headed for a crash. While I was in the concerned camp, the recent price action is telling me that stocks want to continue to push higher from current levels. Price can correct in two ways 1) through price pulling back and creating new support levels lower or 2) price can trade sideways through time and build a new support base at current levels. Scenario 2 is the most bullish option as it suggests current holders are unwilling to sell which keeps demand for new shares tight, causing new buyers to pay up a little more to get involved.

SP500 weekly chart
You can see the extended sideways trading action of late in the SP500 and the subsequent breakout. I personally don't feel a market is overbought only 2 weeks removed from a 6-month consolidation and base formation. My quantitative data does not support an overbought market currently either.

 Emotional traders and the media are so short term in their thinking that they constantly invoke a phrase borrowed from Jack Schwager's book, The New Market Wizards, called "the call of the countertrend". They spend so much time trying to pick every top tick in a runaway uptrending market that they lose the forest for the trees. The call of the countertrend makes it seem optimal to attempt to take your small profits now so you are less likely to give them back when the market goes through an orderly pullback. But what this conditions traders for is a situation where all immediate gains are taken quickly and therefore not allowed to turn into major winning trades that can make your whole year.

Have you ever heard of the 80/20 rule? The 80/20 rule suggests that 80% of your profits will come from 20% of your trades/investments. A successful system will have lots of small losses but when a big winner does come along, it will make more than enough to cover those losses plus grow your account balance over time. If however you are constantly taking small profits in accordance with countertrend thinking you will never be able to participate in those large, game changing trades.

The market programs us to think that it will take back any profits we make so we need to take what we can get quickly as to not lose them back to the market. This kind of conditioning is what the market does best: drain money from the majority's accounts and line the pockets of the minority. The market is designed to get the majority's money and failing traders fall into the trap of quick, small profits.

 It is said that amateurs go broke taking large losses, while professionals go broke taking small profits. It would logically follow then to make money one would need to let winning positions continue as long as possible and simultaneously cut losing trades quickly as to not incur large losses. Keep losing trades small and allow winning trades to win big...That is the way of the minority and the way of a winning trader. It will go completely against your natural instincts as a human (the concept known as Risk Aversion)
but is absolutely necessary for your success in the markets.


--We had one notable addition to our holdings list this week and we also had one trade from last week to discuss as well. Over the last two weeks we received an add signal for PPG and a new buy signal for Ford. Lets take a look at these new developments to be positioned correctly heading into next week.

PPG (3/3)
Last week PPG broke above its 13-week support base to the upside and signaled yet another trend resumption. This stair stepping action is exactly what a sustainable trend is all about and we will take this new signal and add to our existing holding. We can now slide our stops up to the $188 swing low, making this a continued winning trade for us going forward.


F (2/3)
Ford was able to take out its prior swing high this week and did so in strong fashion. There is a lot to like about how Ford handled its recent correction. Since signaling our exit, the stock orderly pulled back to retest the prior inflection point at $14.50. Once that level was tested, buyers came right back in and price slowly reversed the weakness and this week triggered our Buy. For initial positions a stop at $15.50 makes sense here as that would signal a failed breakout, it would also violate the rising 20 WMA and the prior swing low.

There is some long-term supply likely at these levels and just ahead, but we take our signals based on our prefered intermediate term trend direction and let the rest take care of itself through time. Also don't forget that there is a massive support base forming here since the '99 correction.

  This is the Monthly view going back 15 years. Since making a new low in late 2008, price has stabilized well and has the look of a bullish Inverse Head/Shoulder base. A breakout above $18 would set this into motion on the monthly chart. This base formation projects a potential 100% upside move and all we have to do is enter a position currently with a $1.50 risk per share. That is a stellar risk/reward proposition and one that will make you a lot of money over the long term probabilities.


Chart of the Week 

Treasury Bonds (TLT)
Treasury bonds make the Chart of the Week this week due to thier typical inverse relationship to stocks. With stocks on the verge of another big breakout move, TLT is finding itself getting squeezed between long-term downtrend resistance and a strongly rising 20 WMA. This will soon be breaking one way or the other and that move will likely have strong implications to the direction of the overall stock market. It should tell us whether this stock rally is likely to fail or if it has the legs to continue the uptrend. We need to watch bonds closely here.

Two weeks ago our stop was near the $109 area, but with the movement of the 20 WMA we will slide that stop up to the original $110 inflection level, which is where the 20 WMA currently sits. If we get a close below just about $110 it will be time to set aside in TLT and we would expect stocks to continue to outperform.

Zooming in and taking a look at the Daily chart, TLT is working through a very typical reversal setup. We have seen a steady trend of higher highs and higher lows for the last several months, but the last two weeks of trading action suggest a change is upon us. Take a look:
We saw price gap higher through the downtrend resistance level only to show no upside follow through and then fall back into the prior downtrend. What makes this gap and pullback different from others is the fact that this is the first time we have seen price make a lower low on that pullback. On Tuesday of last week there was a swift move through the prior swing low and we have spent the last couple days throwing back to that prior swing point. When you see a strong new high followed by a rapid pullback that creates a lower low that is a major warning sign that the trend may be changing.

We will need to watch this closely in the week ahead to see if it can hold here and make another higher high or if it will continue lower through our $110 breakout level.

Lastly note the Relative Strength trend. It is sitting right on its uptrend support going back six months. That should provide a great hint to the strength or weakness of the next move to come. We have been long TLT for a while now and the trade has been good to us. But don't forget we need to continue to manage risk in all environments. This one may be telling us soon that stocks, not bonds are the area of strength going forward.