Your trade system will go through periods of good fortune and bad, the important thing is to be able to identify those times and press when trade success is high and withdraw when it is not. When your trades are working, you are in a favorable environment for your system and you need to be sure to capitalize on those streaks. You need to have a simple way of identifying when the market is favorable to your particular strategy. My strategy performs best during trending markets, either up or down. My strategy struggles in choppy and range bound markets. That being the case I need to have a way to determine if the overall environment is favorable or not. The way I do this is to simply place the SP500 against its long-term trend averages. I look for a signal that tells me if the market is likely headed higher, I encourage you to do your own research to identify your specific parameters for being in the market or not.
SP500 monthly bars
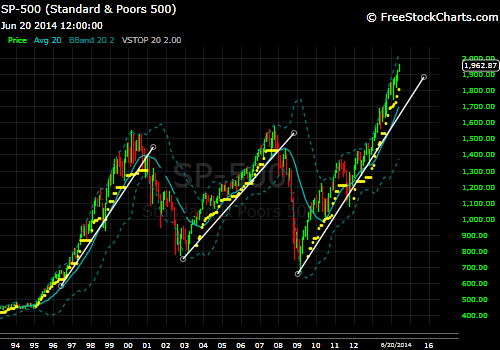
Here's a zoomed in view of the current rally and bull market:

As you can see, my basic market gauge suggests that we are still well within the long term uptrend and bull market. That being the case the market is favorable for my particular trend strategy and I am still looking for new setups aggressively. When conditions shift, I will become more defensive and less interested in putting extra cash to work.
Continue to take your signals that are in sympathy with an uptrending market. Don't worry about what the news says and don't be too eager to pick the top of this market. Most investors think the only risk present in the market is for stocks to correct lower. However one of the most costly risks to investors is not taking advantage of strong markets and missing the majority of an upward move. They are so fearful of a crash from the highs that they fail to invest accordingly to the current environment. Emotional investors tend to sell too early and buy too soon into declines. We are taught that we should buy low and sell high, the problem is that theory supposes one can identify tops and can time bottoms. Most simply cannot do that, yet there are those who have lost quite a bit trying to do just that, going on several years now. Don't be one of those investors that gets so wrapped up in a story that they fail to see what's happening right in front of their eyes. If the market is going up you want to be heavy in stocks. If the market is going down you want to reduce exposure and play defense. Get your money in when you have the best odds and protect it when you don't, don't give anything away. The name of this game is to keep risk as small as possible while keeping returns as high as possible. The way you do this is to ride winners as long as the uptrend is valid and cut losing positions early and aggressively.
We had no changes to our portfolio this week and most holdings moved to higher prices. There are two items of note heading into next week:
TLT
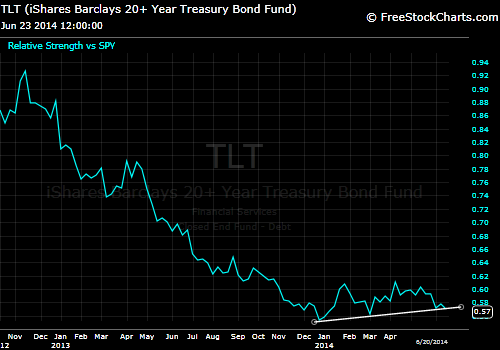
After bouncing nicely last week off the current RS trend support, TLT vs SP500 (TLT:SPY) rolled back down into the support area again. I will be watching for a break of the uptrend and a move below .56 to invalidate the Relative Strength. That move would also prompt me to reduce some of my TLT exposure going forward.
PPG

Chart Of The Week
Intel (INTC) Monthly bars

There is a common phrase that technical traders like to use, "The bigger the base, the higher the move in space". A consolidation of this nature can create quite a supply/demand shift as left out participants will be scrambling to get a hold of some shares. The beauty of a base this long is that while the recent rally has been strong, there are still many out there who will not believe in this setup for a long time to come. The sideways movement frustrates both long-term investors and shorter-term traders in that no real trend develops and their initial investment made 10-15 years ago is worth the same now as it was then.
There is another common saying that states, "if a consolidation doesn't shake you out, it will wear you out". I believe many are worn out here by Intel. The interesting thing I have noticed anecdotally when asking people about INTC is that they blow it off as being "boring" or "dead money", I have to put myself in that category as well, up until last week I thought similarly. But things change and we have to change with them. I do still believe that INTC below this breakout level is likely dead money, but above it...oh boy, this thing could be headed way higher! Most investors have a hard time buying a stock when its been up, but that is one major reason why most investors fail to make money. This may have moved a bit since the 2013 lows, but relative to its historic pricing there is plenty of upside potential.
This assessment would become invalidated below $25.50. Above that, there appears to be lots of open air.
No comments:
Post a Comment