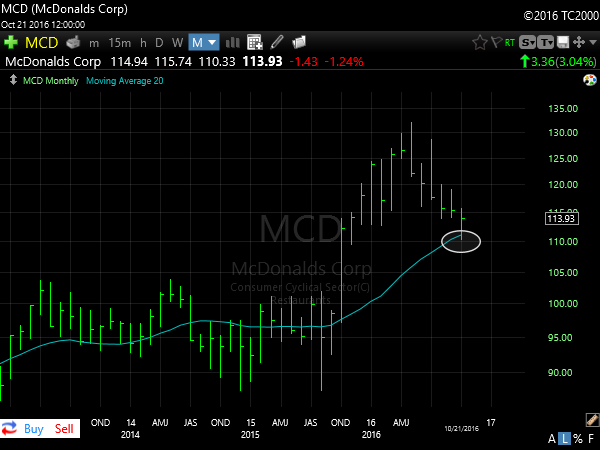
I use these consolidations to add exposure to current positions and to get a sense of where some hidden value may be found in an uptrend.
Good things tend to happen when prices near these levels. Either the response is rapidly positive or the stock will alert you to more trouble ahead. The risk/reward therefore sits firmly in our favor by heeding this pattern.
Check out some of the opportunities we have been involved in this past year due to this particular pattern:
NFLX
UNH
ABMD
AMZN
FB
TSN
RAI
Similarly this pattern can act as a strong indication that trouble may be lurking ahead:
TWTR
GILD
WFC
Here are a few to watch currently that are setting up as we speak:
HD
MCD
AEP
TXRH
CHK
These are long-term patterns and don't automatically suggest a buy or sell, but when prices approach this area I become very interested. Pullbacks of this nature (or rallies in downtrends) tend to catch most short-term investors quite off-sides to the more dominant trend in place. We tend to get sucked into the day-to-day action but the big moves start here, on the long-term charts. The reason these setups tend to work and be explosive is exactly because enough time has elapsed to dull the senses of short-term participants. While they are ignoring the "messy" setup based on the Daily timeframe, the long-term momentum is about to ignite providing strong value for those paying attention.
The Home Depot example above really drives this theory home. I recall back in mid-2014 when the return of HD over the past 12+ months had been literally zero. Traders had no interest at all in the name and I was becoming very very interested. At the time the stock was trading between $75-80 per share. It wasn't until mid summer that the trend ignited higher; over the next 7 months HD went from $80 to nearly $120 in a straight line. I then recall the sentiment surrounding the stock at the beginning of 2015, everyone was bullish and just dying to throw money at it.
The above example is not an anomaly, most market participants have a very short attention span and don't have the patience to try to see the bigger picture. They have a tendency to chase the flavor of the week and ignore where the relative value is hiding, gearing up for the next advance.
Again these patterns don't always work but they tend to skew the odds in our favor over the long-term. I have seen enough examples over the years to know this pattern pays much more than it loses. When prices approach the long-term trend average good things tend to happen and it is wise to pay attention.
Thanks for reading
-ZT


I find it insightful how focusing on long-term trends can reveal valuable investment opportunities.
ReplyDelete