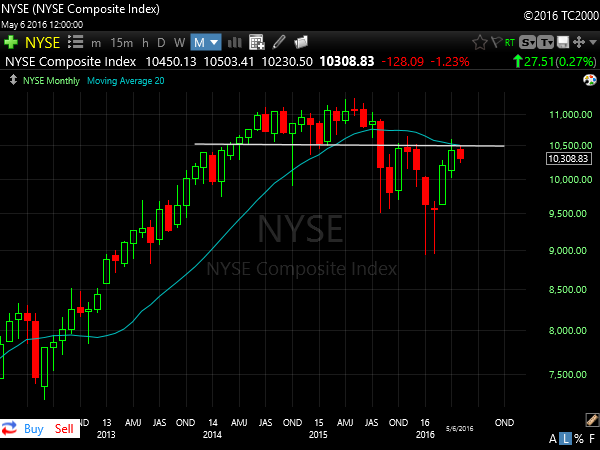
-Probably the cleanest of the market Indices in terms of a Bull/Bear outlook. Above ~10500 Bullish, Below Bearish. This is a very broad reading of the general trend in equities. Prior support has proven once to be new resistance, will it prove this way a second time? I'm approaching this as my primary indicator of broad market health. Above the prior high I will treat this as bullish confirmation of the prior rally and will be aggressive with new positions. Below the high I will approach this market skeptically and with more caution.
AAPL Weekly
AAPL is becoming a real battleground stock. Carl Ichan selling, very high weighting amongst funds and Indices, "cheap valuation", concern over lack of innovation, etc.
AAPL is becoming a real battleground stock. Carl Ichan selling, very high weighting amongst funds and Indices, "cheap valuation", concern over lack of innovation, etc.
Bottom line the intermediate trend is lower and substantially so. The stock will certainly rally at times, but until more demand can come in to stabilize the stock it remains an easy avoid for my timeframe.
Even the short-term trend is lower, there are simply no signs of confident buying (which is what forms lows).
Yield and Safety Plays Lead
Without question Staples are the strongest sector in the market currently. All dips are being bought and the trend continues higher.
REITs are another area that remain on fire and seeing very positive price action. They currently display a rare combo of growth and high-yield, usually mutually exclusive traits in the markets.
Within the REIT space these are a few names I like:
Within the REIT space these are a few names I like:
CUBE Weekly
Financials find themselves in an interesting position. The weekly chart shows a major gap-fill took place last week. I give a lot of weight to gap activity and whether a rally or pullback will reverse/continue based on a key gap area.
I treat gaps as major support/resistance. Should the XLF reverse back above the recent gap-fill I would take that as a bullish sign and adjust my thesis. Below the gap I will continue to treat them with distrust and look for opportunities on the short side.
The Monthly chart also confirms this area of interest. Price is colliding with prior support and a now declining 20 Month SMA. Again, above good/below bad.
Energy looks to be forming a potential base reversal. It could still use some time in this area building the right side to rally from, several months would be excellent.
After looking pretty sharp over the past month, Oil slowed its trend and may be encountering some substantial supply. Traders appear to be selling into strength since the recent breakout attempt at the end of April. Some time to digest overhead supply might be a good thing for higher prices in the future.
I've been quite critical of this stock for sometime. It's recently undergone a massive 10-week rally. But after breaking what looked like major intermediate resistance the stock just tanked back through this key level and 50 DMA. This change in action is something we need to be aware of and be looking for in new potential setups.
IBB Biotech
Among the "false breakout" perpetrators, Biotech is showing what can happen when these moves fail.
Among the "false breakout" perpetrators, Biotech is showing what can happen when these moves fail.
We recently took a position on the initial breakout but were stopped out on 4/28. The ETF has since dropped 10% in only a few trading days. As far as offensive leadership is concerned, Biotech is a group that we like to see rallying with the market. It shows a healthy demand for risk from investors, but we are not currently seeing this.
With Staples leading and Biotech lagging it shows the current intentions and conviction of the money being put to work. That conviction still favors safety and yield rather than high risk/high reward.
Everyone is now very focused on the Dollar and believe it will be responsible for the next move in stocks. If that's the case what is it saying?
There was a decent rally this last week and UUP is now retesting the underside of it's broken 18-month support. A move back into the prior range would be seen as bullish activity and a sign of a failed breakdown. Continuation below would be bearish for the Dollar but would seem to be positive for the overall market.
This is my broad definition of an uptrending market. A pullback to the 20 WMA would be ideal. The hope would then be to see the support hold and for the MA to curl under price. This would provide a strong launch pad for a sustained move higher.
Thanks for reading
-ZT
Thanks for reading
-ZT


very good analysis. Simple yet effective
ReplyDelete