
I've discussed in the past how I like to use the Weekly MACD indicator. Typical analysis (lazy analysis) tells us when the MACD line crosses above the signal line that it creates a bullish event. In my experience its much more important to view the overall position of the indicator rather than whether its in a "crossed position" or not. In fact the "bull cross" that occurs after a strong move into negative territory (below the zero line) is almost always an awful timing indication. Its a trap signal that fools those who take little time to study the actual momentum. We are currently seeing this "bull-trap" crossover. If you look at what happened the last week of October 2015, we saw a similar crossover that occurred 30 points from the ultimate high (this came after a nearly 200 point rally in 5-weeks).
Here we are again. 200 points off the low and NOW it appears to be a good time to follow the indicator Long? I guess some people actually think this way, god help them. If history is any guide this signal should tell us the ordinary, lazy man is bulling up on stocks here and is just about to have his head handed to him again. Thank you sir may I have another.
SP500 Monthly


Typically these key moving averages act as support during uptrends and resistance during downtrends. How the market responds at this level will be very important for the continued health going forward. A monthly close back above the 20 Month SMA will put the market back on stronger footing. But the longer price stays below this critical line, the higher the chances we do enter into a prolonged downtrend and bear market.
Of course in our current environment it doesn't take too long of talking bearish before your prophesy is fulfilled. Rather than continuing on about why we are doomed to go lower at some point, lets take a look at a couple new Long positions we opened this week and our remaining Lg-Cap Portfolio holdings.
We follow price and Relative Strength. Getting too worked up about what could happen in the future is generally why most fail to keep up with the market. Successful management means not having a strong opinion of what we can't control, but instead focusing on strength and leadership from where ever it may come.
+Entering Sherwin Williams (SHW)

In corrective markets the indices continue to make lower lows yet some individual stocks will begin to bottom sooner and be diverging prior to the absolute low in the indices. This may be what we are seeing with SHW here. There is no telling whether the low for the market is in, but if it is Sherwin will likely be a leader in the next rally.
When looking at the Daily or Weekly view the stock seems pretty extended due to its recent rally. But when you take the move in the larger context of the Monthly timeframe it's not extended at all.
Monthly
 We've seen a year long sideways consolidation that has allowed the rising 20 MMA to catch up to price. There have been two tests of the average and now appears ready to break away again.
Monthly

For risk management purposes we can use the swing low near $240 as our stop. That would break the recent uptrend and take price back below the 20 MMA support. Because of the slightly wider stop our position will be a little smaller than normal. However should this trend continue we will have plenty of opportunities to add to positions as we raise our stops in the future.
+Entering United Healthcare (UNH)
 UNH has had a very orderly correction through time rather than price over the past 18-months. This week we saw the highest weekly close ever for the stock. While there still remains some resistance at this level, its a very constructive sign to see a prior leading stock like UNH back to new weekly highs.
Similar to SHW above, UNH has slowed its ascent enough for the 20 Month MA to catch up and act as support on the recent consolidation. Over the last 6 years, tests of the rising 20 MMA have been tremendous buying opportunities and have led to strong rallies. Until this pattern changes we will follow along.
Monthly
 Using both the weekly and monthly support levels we will place our initial stops at the recent swing low at $109.25. That gives us a solid cushion to work with and also allows us to stay long the stock provided it holds above its long-term average price. Since the bull market began in 2010 this stock has not once closed a month below its 20 MMA. Lets ride it while it lasts.
-Exiting CVS Short
 With the market rallying relentlessly it only makes sense that CVS follows along. While it remains a relatively weak stock overall, by breaking above above the critical resistance level at $100 means we have to step aside. This was a small price to pay to see if weakness would prevail. Since it did not we take our lump and move on.
FB
 Facebook held a test of its 20 WMA this week and continues to hold above first support levels. Should it move to new highs we will be able to trail stops near this week's swing low. Until then however we have to keep them out of the way at the most recent pivot low near $95.
There is no sense getting antsy here. In terms of relative performance FB has been one of the best names to own in the market.
GE
 GE held its prior breakout level and is now attempting to resume to higher highs. Due to the recent consolidation and subsequent strength we will trail our stops to the latest swing low ($27). While it hasn't been confirmed yet with a higher high, I am confident knowing that if this recent low should fail we could step aside due to a failed long-term breakout.
Also because of the higher trailed stop we can increase our position size by about 40% and still keep our open risk at .5R.
AEP
 AEP resumed its uptrend with a higher swing high since breaking out several weeks ago. This is now just 2% from its all time high set in early 2015. I see little to suggest it will not surpass that and move to new highs soon.
Utilities remain the strongest sector in the market
PCG
 PCG had a good week and is only slightly trailing behind AEP. This remains poised for higher prices, not to mention a fat dividend for enjoying the ride.
PM
 PM despite some softness on Friday this continues to crush following its multi-year breakout. Little reason to be worried about this name. Sure it may pullback, but the trend remains firmly higher.
Short GD
 GD remains a Short for our Portfolio and is currently the only open Short we hold. Below the swing high at $138.50 I like the chances for lower prices.
With the recent strength continuing across the markets conditions are no doubt improving. However the strongest setups I am seeing remain Shorts rather than Longs. Most still need some time for optimal entry points but I think given some consolidation they could be ready in the not so distant future. Here are some things I'm watching on both the Long and Short side:
Watchlist- Long
MDT

HD

XOM

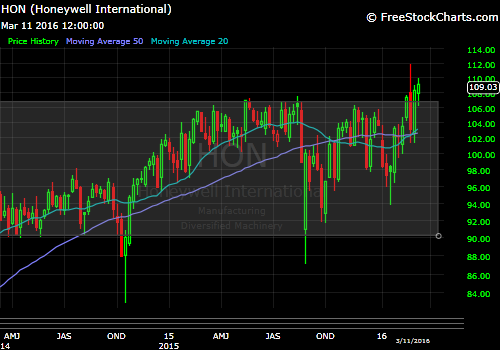
HON
Watchlist- Short
AAPL

C

BAC

GILD

V

Thanks for reading
-ZT

Similar to SHW above, UNH has slowed its ascent enough for the 20 Month MA to catch up and act as support on the recent consolidation. Over the last 6 years, tests of the rising 20 MMA have been tremendous buying opportunities and have led to strong rallies. Until this pattern changes we will follow along.
Monthly

-Exiting CVS Short

FB

There is no sense getting antsy here. In terms of relative performance FB has been one of the best names to own in the market.
GE

Also because of the higher trailed stop we can increase our position size by about 40% and still keep our open risk at .5R.
AEP

Utilities remain the strongest sector in the market
PCG

PM

Short GD

With the recent strength continuing across the markets conditions are no doubt improving. However the strongest setups I am seeing remain Shorts rather than Longs. Most still need some time for optimal entry points but I think given some consolidation they could be ready in the not so distant future. Here are some things I'm watching on both the Long and Short side:
Watchlist- Long
MDT

HD

XOM

HON

Watchlist- Short
AAPL

C

BAC

GILD

V

Thanks for reading
-ZT
No comments:
Post a Comment