The best advice I can give to a new trader is to look for stocks moving sideways. That might sound strange coming from a trend trader. But the key is how a stock emerges from a sideways period that will tell you everything you need to know to buy or sell. The sideways movement assures that the stock in question is not overbought or due for a correction. It shows that the current price range is an area of support and as long as the stock is above the lows of the range, the risk/reward is tipped in your favor. Almost every one of my big winning positions have come from long-term sideways bases that resolve to the upside.
Ideally these sideways trends occur at multi-year or all-time highs. This shows an unwillingness for traders and investors alike to sell the stock. They are confident in their positions and do not want to sell. This tight supply is what creates the breakout momentum as those looking to buy have to pay up to get in.
I like a base to be at least 6 months, but preferably a 1-year sideways trend gives the most upside potential. Moves from bases this size can be spectacular.
Thriving in the market doesn't come from making wild moves, but rather from managing risk and being consistent. The beauty of a sideways trading range (consolidation) is that it defines the risk perfectly. If the stock resumes from the base lower, you know something is wrong and its time to look for a better opportunity. But when it resolves to the upside, some of the best trades in the market are made.
Here are some recent examples of large base consolidations near highs:
All charts shown are Weekly Bars
HD
NKE
SBUX
BA
IP
New Base Opportunities:
TMO
Update: TMO +6.8%
UA
Update: UA +7.5%
ISBC
Update: ISBC +8.6%
FB
Update: FB +35%
*These charts were originally posted on 2/27/15 when the SP500 was trading at a weekly closing price of 2,105. I think its important to note that every single one closed the period higher from our original post date. The SP500 is currently trading at 2,056, a decline of -2.3% during that same timeframe. The takeaway isn't that we predicted which stocks would outperform the market or that the market would be poor in 2015. Rather it should be that stocks trading in a tight consolidation, especially near all-time highs tend to trade strongly when they move out of these bases to the upside. We don't have to predict the market to do well. We simply need to observe and react. A simple strategy of buying relatively strong stocks moving higher out of multi-month base formations can be an excellent way to identify great risk/reward opportunities.
Current Opportunities (12/28/15)
LOW (Long as of 11/20/15)
TSN (Long as of 10/9/15)
PANW
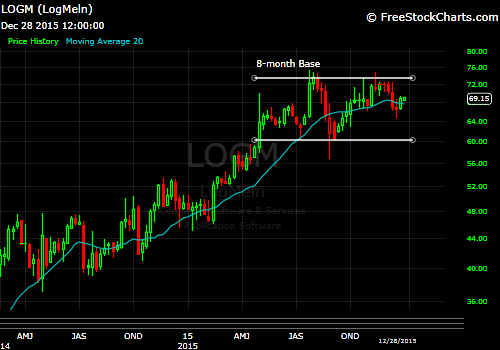
LOGM
PLKI
TSLA
With exception of LOW and TSN these other opportunities have not broken out of their current base formations. Until they do they should remain of watchlists for this particular strategy. But as we have seen before, stocks that consolidate sideways at new or multi-year highs tend to become market leaders when/if they do breakout to the upside.
They don't always work once they trigger, but you put the odds greatly in your favor with a setup like this. If they fail, your exit point is obvious and well defined. If they move in favor, one or two of these moves can make your year. Good luck out there in 2016!
For ongoing analysis and new base formations, please follow @ZenTrends on Stocktwits and Twitter.


No comments:
Post a Comment