Monday, December 28, 2015

What I Look For in the Market

*This is a post I sent out in early 2015. I feel it is a very important concept to understand. This is how I approach all opportunities in the market. I thought I'd offer an update to how the "New Base Opportunities" played out since this last post, and I have included some current ideas I'm either Long currently or are setting up for new breakouts. I hope it helps your results in 2016. 

The best advice I can give to a new trader is to look for stocks moving sideways. That might sound strange coming from a trend trader. But the key is how a stock emerges from a sideways period that will tell you everything you need to know to buy or sell. The sideways movement assures that the stock in question is not overbought or due for a correction. It shows that the current price range is an area of support and as long as the stock is above the lows of the range, the risk/reward is tipped in your favor. Almost every one of my big winning positions have come from long-term sideways bases that resolve to the upside.

Ideally these sideways trends occur at multi-year or all-time highs. This shows an unwillingness for traders and investors alike to sell the stock. They are confident in their positions and do not want to sell. This tight supply is what creates the breakout momentum as those looking to buy have to pay up to get in.

I like a base to be at least 6 months, but preferably a 1-year sideways trend gives the most upside potential. Moves from bases this size can be spectacular.

Thriving in the market doesn't come from making wild moves, but rather from managing risk and being consistent. The beauty of a sideways trading range (consolidation) is that it defines the risk perfectly. If the stock resumes from the base lower, you know something is wrong and its time to look for a better opportunity. But when it resolves to the upside, some of the best trades in the market are made.

Here are some recent examples of large base consolidations near highs:

All charts shown are Weekly Bars

HD

NKE

SBUX

BA

IP


New Base Opportunities:

TMO

Update: TMO +6.8%

UA

Update: UA +7.5%

ISBC

Update: ISBC +8.6%

FB

Update: FB +35%

*These charts were originally posted on 2/27/15 when the SP500 was trading at a weekly closing price of 2,105. I think its important to note that every single one closed the period higher from our original post date. The SP500 is currently trading at 2,056, a decline of -2.3% during that same timeframe. The takeaway isn't that we predicted which stocks would outperform the market or that the market would be poor in 2015. Rather it should be that stocks trading in a tight consolidation, especially near all-time highs tend to trade strongly when they move out of these bases to the upside. We don't have to predict the market to do well. We simply need to observe and react. A simple strategy of buying relatively strong stocks moving higher out of multi-month base formations can be an excellent way to identify great risk/reward opportunities. 

Current Opportunities (12/28/15)

LOW (Long as of 11/20/15)

TSN (Long as of 10/9/15)


PANW

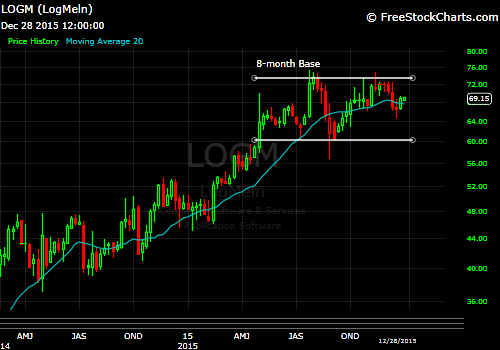
LOGM

PLKI

TSLA

With exception of LOW and TSN these other opportunities have not broken out of their current base formations. Until they do they should remain of watchlists for this particular strategy. But as we have seen before, stocks that consolidate sideways at new or multi-year highs tend to become market leaders when/if they do breakout to the upside.

They don't always work once they trigger, but you put the odds greatly in your favor with a setup like this. If they fail, your exit point is obvious and well defined. If they move in favor, one or two of these moves can make your year. Good luck out there in 2016!

For ongoing analysis and new base formations, please follow @ZenTrends on Stocktwits and Twitter.

Saturday, December 26, 2015

Sunday, December 20, 2015

Distribution Picks Up

That was quite a ride. Despite the early three-day surge, Thursday and Friday erased all the gains and closed lower for the week. Once again the SP500 had a weekly range of more than 3%. This makes 5 out of the last 6 weeks with the market moving more than 3% from the high to the low. I don't know about you but that kind of roller coaster makes me plenty queasy.

SPX Weekly

Early in the week, especially Wednesday when the Federal Reserve announced its first interest rate increase in nearly a decade, it appeared new highs were the most likely scenario. But instead of upside follow through the Bulls got more of a "Red Wedding" than a king's welcome. The SP500 has now closed two consecutive weeks below a declining 20 WMA. While anything can happen in this market, the signal the price action is sending is not one with a bullish bias. The most likely course of action in my opinion is another test of the lower range near 1850. As is typical with range behavior the market should move from the higher bound to lower and back again. We could very well be seeing this play out. 

We take the longer timeframe with our trades and we were able to withstand the volatility this week. We had no changes to our Lg-Cap Portfolio. We remain Long $COST, $LMT, $GOOGL, $FB, $GE, LOW, $AIG, $UUP, Short $AXP, and 50% Cash. While the market gyrates wildly, leading stocks continue to maintain enough resiliency and cushion to hold above key supports. Because many of our holdings ran so much in November it seems likely that most could survive the market testing its Aug/Sept lows. Should things escalate beyond that however we would likely move back to a full cash position. Again these are problems we can face with as they come, for now we will deal with the market we have.

Weekly Charts Show Heavy Selling

Distribution signals are showing up in mass. This is an ominous sign going forward:


TWX
If you remember we took exit signals in $TWX Longs on 8/17 at $80 per share. While that was a discouraging stop to take, you can see why we stick to our support levels. Since that breakdown the stock has declined more than 20% and is now below major support. This chart has triggered a two-year Head/Shoulder Top and we will stay far away. This formation suggests prices could move to the $50 level, another 20% lower.

GS
 Goldman is sitting on a big level. This was the key resistance since the 2009 decline. It is now testing it as support for the fourth time since the breakout in mid 2014. With sell volume increasing and price below a declining 20 WMA, it appears this last test may be the one that breaks it. A failure to hold $170 sets up a potential move to the ~$120 area.

 AAPL
 We exited AAPL on 7/24 at $124.50. The stock has now declined 20% from our exit. Apple has been relatively weak for months and sellers continues to outpace buyers. A break of $105 on a weekly basis sets up a major breakdown. This is a widely loved and widely held stock. Most feel a substantial decline is not possible, to me this means its all the more possible.

APC
APC has a clear Head/Shoulder Top in motion and the stock has already moved 40% from the breakdown point. The measured target suggests we could see an ultimate move into the mid $20's before this is all said and done. There has also been heavy selling volume since the recent throwback attempt which shows major money moving away from the stock. There is also the possibility that this is working on a capitulation bottom, but we will need to see significant stability in prices before an end to this move can be considered buyable. 

 UNP
UNP has seen above average selling volume in 6 of the last 8 weeks and just recently moved to lower lows. For a prior market leader to be this weak shows that any stock can be taken down. Long-term this is a name I believe in highly so every tick lower means we will have an even better buying opportunity sometime in the future. 

UTX
A classic Double Top formation is in motion for UTX. It has successfully retested the $100 swing point and subsequently rolled back to the downside. This is a clean breakdown and the pattern suggests a move near $80-75. It should be noted selling volume has increased each of the last three weeks, this is not typically a bullish development. 

FOXA
FOXA traded in a very orderly range for nearly 18-months before failing support at $31. Once again we've seen a perfect throwback to the breakdown level and subsequent rollover. This is bearish price action. 

IP
 IP looks quite similar to FOXA above and this week closed at new multi-year lows. This is an easy avoid at this point. 

The takeaway from this is the market is showing classic signs of major selling, selling that also doesn't look like it's through yet. While there are still some hopeful trends out there, those continue to dwindle. The gameplan for me going forward is to remain flexible, hold lots of cash and let the market lead. I especially don't want anything to do with stocks already breaking to lower lows and seeing above average selling volume. Avoiding these downtrends has worked wonders for keeping us out of trouble so far in 2015 and I see no reason to think I can call the bottom now. 

It's always best to let these downtrends play themselves out and let them turn higher before we step in as buyers. It's important to heed this market warning and avoid the worst stocks. 

Outperformance isn't all the difficult if you simply avoid the worst stocks in the market. Seek strength, seek winners, and avoid the worst performers and you will see your returns grow. 

Thanks for reading 
-ZT

Saturday, December 12, 2015

Whip it Good

It was another volatile week for the markets and mostly in a straight line lower this time; the SP500 declined 3.7% from last Friday's close. With next week's Fed decision looming large, it appears many are readjusting their risk to account for the uncertainty of an interest rate increase. Whether you feel this action is justified or not should have little bearing on your positioning. We must continue to listen to the market and be positioned in accordance to what its telling us.

SP500 Daily
The "higher range" I've been watching for several weeks was broken to the downside on Friday's selloff. Also the breakdown came from a failure to hold the 50 DMA for the first time since October.

SP500 Weekly
The weekly bars show more deterioration. The 20 WMA is now declining again and price has clearly violated that line. It also appears we are setting a lower high following the lower low in August. Lower lows followed by a lower high is the definition of a trend change.

While most are clamoring for the dramatic, either positioning for an epic crash or a melt-up rally, I think both may be disappointed. As far as I can tell this market remains in a trading range between the highs at 2,135 and support near 1,860. Until these borders are broken my approach will be based on this range and my risk exposure will reflect the environment.

I won't be ignoring strong risk/reward setups in the strongest stocks, but I also won't be in a hurry to max out my exposure until we have more clarity of trend. My research suggests new positions have a much higher probability of success when the broad market is trending higher. When this trend is not in place I make sure new entries reflect the lower odds given by the lack of trend. I will size new positions smaller in these lack of trend (or downtrending) periods. 

It's not all doom and gloom though, according to the historical seasonality of December going back to 1928 suggests we are nearing the strongest trading period of the year. Here is a chart that was shared on Twitter that I found of particular interest:

Chart posted by @aandragon. 

Now this doesn't mean it has to happen of course, but it does give some perspective to the potential positive that could come in the last couple weeks of the year. 

Regardless of which way we come out of this week's move, I have little doubt the moves will continue to be volatile and challenging to trade. So be prepared for more of what we've seen so far in 2015. 

I remain positioned with at least 50% cash in all accounts and I see no reason to change that at this point. Currently I'm seeing many more breakdowns than breakouts. My review of the S&P100 stocks showed further deterioration this week dropping to just less than 3-1 downtrending vs uptrending names. I know many don't feel it's necessary to watch the indices, but the fact remains if the majority of stocks are failing to trend higher the market will have a headwind. To give some perspective on how this breadth divergence has manifested itself in the price action, we haven't seen more than 50% of the S&P100 stocks in uptrends since the week of May 15th. That reading came exactly one week before the all-time high for the SP500. From that point in May, breadth has continued to trend lower and stocks have performed weakly. 

Again these breadth divergences don't mean a rally is impossible, it simply means the odds of that occurring are less. A big part of our success in the markets hinges on us taking the highest probability trades possible. Studying your past trading performance will go a long way to clarifying exactly when your strategy is at its best and worst. Knowing when to be aggressive or conservative is a very important concept to understand. 

You don't always have to be fully invested. Sometimes we will miss moves by being more conservative, but if the odds don't support an aggressive posture it's important to follow that. Following the longer-term odds will only add to your positive expectancy over time. Since we know the market will always be there, there is little reason to force an unfavorable trade when we can wait for the very best opportunities.

We had no changes to our Lg-Cap Portfolio this week but there are a couple things to note. Costco missed their earnings estimates and AIG broke its 20 WMA and is testing stops.

COST
 The response to Costco's recent earnings were not positive. The stock posted an engulfing bar on higher than average volume. I said last week that with the recent run the stock has had a pullback/consolidation wouldn't be unexpected. In fact a retest of the breakout at $152 would still be quite constructive to the longer term picture. For now there is nothing to do but give it some room. I would expect buyers to show up fairly quickly as this remains a quality name and strong trend.

AIG
AIG gave about as negative a reaction for a new entry as possible. From Monday morning's opening gap lower, the stock had a non stop skid into our stop level. It was able to hold just above $59 to finish the week, but this will be on close watch for a stop out going forward.

Other than these two moves there wasn't much notable from the rest of our holdings. Most held up quite well and are still showing strong trends. If we see more deterioration in the next couple weeks I'm sure more of our holdings will become vulnerable, but we will cross that bridge when we come to it.

Our watchlist took some damage and is now much more narrow. Potentials ECL, GILD, WFC, CMCSA, and UPS all need more stability before they will make the cut. Our most hopeful names to watch are PEP, BAC, INTC, and BA

PEP

BAC

INTC

BA

Thanks for reading
-ZT

Saturday, December 5, 2015

Lg-Cap Portfolio Review

Markets remain largely range-bound. The SP500 gained 1 whole point for the week but it wasn't without action. As @michaelbatnick mentioned sarcastically on Twitter, it was a boring week. Here is what you saw if you were following closely:

SP500 for the 1st week of December
The last day of November got off to a slow start for the week. After a strong move on Tuesday, Bears took the market down 60 points (~3%) on Wednesday and Thursday. However markets obviously liked the Jobs data on Friday and rallied back more than 40 handles to close the week flat.

Depending on your timeframe these gyrations can be very actionable or completely meaningless. If you are a short-term trader there was likely opportunity on both sides this week. But for longer-term participants this was just another noisy consolidation just below market highs. 

I'm still in the camp that this market is in an extended range environment and there is no telling how long this will go on (a breakout above 2,135 would suggest a more bullish posture). A scenario I've considered is one of a longer-term sideways move. How difficult would it be for most if the SP500 just whipped back and forth in a 200-300 point trading range for multiple years? With the rise of passive index investing, where most just buy a low cost index fund and play the long-term game, a zero return market for multiple years would seemingly frustrate the majority. 

Most traders/investors have some sort of directional bias when they approach the market. Meaning they believe that the market will go higher or lower for a given period. Bears get emboldened every time there is a brief selloff. Bulls get very confident when markets begin to rally higher. Yet if this week is any evidence, both of these biases get whipped back and forth leaving nothing but a headache for those anticipating the next move. 

This market has been one of little follow through in either direction for much of the last two years. Just when it appears prices are ready to breakdown, a bid comes rushing in at key support. Then when things look positive and rosy, sellers step in and slam prices back down.

This remains a stock picker's market. Traders that have been able to find relative leaders within the choppy environment have been able to stay afloat. Those that have held the indices have seen zero return since November of last year. Others have tried to pick bottoms in declining groups like Energy/Commodities and have been subsequently punished for their anticipation.

Stubbornness by market participants is likely to lead to more pain in the future. Those that are able to stick with winners and avoid losers with an open mind will fare better.

We have one new entry for our Large-Cap Portfolio this week: AIG has re-triggered entry signals after stopping us out in mid-August. With the addition of AIG, our Portfolio is now 50% invested and 50% cash.

+Entering AIG
 While AIG has not made new highs just yet, price has been able to close two consecutive weeks above the prior weekly swing high. This week's move came on increasing volume and has triggered a 5-month cup with handle formation

Our indicators align nicely as well.
The weekly MACD signal has pulled back to the zero line and found support, this is a sign of continued trend strength. I also like that Relative Strength vs the SP500 continues to make higher highs and higher lows.

Taking a longer-term look at this setup shows more encouraging developments as well.
Following the epic collapse of 2007-2009 the stock bounced around violently below the $60 area. There were multiple tests of this level in 2009 and 2010, all resulting in further consolidation. It wasn't until 2014 that price was able to sustain near this resistance without being rejected lower. Early this year the stock was able to finally print higher highs for the range and the August correction found support at this prior level. It appears resistance has turned into support and suggests prices are comfortable at these higher levels.

For risk management purposes we will use the recent test of the range highs and weekly swing low at $59 as our stop.

COST
Costco will announce earnings this week on December 8th. After the rally it has had recently a consolidation/pullback wouldn't be unexpected. With the continued strength this week we can trail our stops to just below the recent swing low and prior highs at $152.

LMT

FB
Facebook appears to be carving our a bullish flag pattern. We still don't have enough of a new support area to trail stops to, but we may soon should it continue to remain strong.

GOOGL
Google remains extended without new support to trail stops. We will just have to be patient with this one.

GE

LOW

Short AXP
American Express made a marginal lower low this week and remains soft. We will soon be able to trail stops to near $74.

Long UUP
 The Dollar took a bit of a hit this week due to strength in the Euro. There is still little damage done to the longer-term trend. Should it find support near this area and move higher we will be able to trail stops to this new pivot area. For now we need to just sit tight and let this play out.

The bottom line continues to be to remain patient. As long as the market is below its highs at 2,135 we are likely to see more of these large weekly and intra-week swings. This is a range-bound market and it needs to be treated as such. We will continue to seek out the strongest names but with the understanding that risk could elevate quickly as we remain trapped below key resistance.

Thanks for reading
-ZT