Over the past year we have been following the markets together,
and I will say I have been pleased with the results. While last year was spent
getting everyone up to speed on managing their money and learning common market
theory, we have built a nice foundation and it is time to evolve our process a
little bit. I have been thinking about what I would want to change with our
Blog Portfolio strategy and our watch list stocks for the last few weeks. What
I have concluded is that I want to adjust some of what we follow and invest in,
while also having a few concise rules we will need to trade by going forward.
Basically I want to continue to simplify our process while also
continuing to post strong returns. Currently we are managing positions on our
Top 10 Watch list and the 9 S&P sector ETFs.
First I have decided that this is a little too many holdings to
currently invest in within our one Blog account. It simply stretches my funds
too thin to adequately fund each position. So I am going to eliminate from the
holdings in our portfolio the 9 sector funds (I will still track their progress
and post monthly on their status) and I also am going to adjust the holdings of
our 10 watch list stocks to fit one stock per sector group. Right now we have
10 stocks that we track:
Financials (WFC)
Consumer Discretionary (HD and F)
Technology (AAPL)
Industrial (CMI)
Materials (PPG)
Energy (ENB and PBW)
Consumer Staple (HAIN)
Tech/industrial (DDD)
The thing I notice is that we don't have each sector equally
represented. We do not track a Utility or a Health Care holding and we have a couple sectors
where we track more than one position. My plan in the coming week will be to
choose a Utility stock (I'm thinking AEP will be the choice), a Health Care stock, and I will need
to consolidate our Energy exposure and Consumer Discretionary. I still only
want to follow 10-12 positions for this account and intend on having one
position as TLT, which is the long term treasury bond. We will want/need that
exposure as a market hedge when the trend inevitably turns lower for stocks.
I didn't want to completely change our watch list as many have
grown familiar with each holding and likely hold the positions in their
accounts. However with the past week's market action a natural rebalance could
be in the cards in the near future anyway. I think now will be a good time to
get that ball rolling to create an even more balanced and targeted watch list.
--The second thing I want to work on is creating a VERY simple and clear
method to follow for exactly what, when and how much to buy of each and any
asset position; what I'm hoping to create is an effective plan that ANYONE can
follow with a simple glance at any asset's price chart. The entry/exit methods
we have used over the previous year will be more or less the same criteria
going forward but we will make a slight adjustment to exactly how it's
executed. Currently we track the 20 WMA, Relative Strength vs the SP500, and
key support/resistance levels. There is no need to reinvent the wheel, but a
few minor tweaks will allow us to maneuver around a position without an
"all in, all out" mentality. This will help avoid being shaken out of
an entire position right as it's about to turn and resume higher.
Here is what I'm proposing:
-each signal will represent 1/3 of a total position size for each
holding.
-since we will likely track 12 stocks, divide our account size by 12 to know how much will be allocated to each holding. We then want to know what 1/3 of each position allocation is, that will be how much capital we deploy when a signal is triggered.
-When a signal triggers we will add 1/3 of a total position size, when a
signal fails we will exit 1/3.
This allows us to manage a position based on several criteria of
strength and therefore only the absolute strongest setups will warrant a full
position size.
-Positions will be ranked 0/3, 1/3, 2/3, 3/3 depending on how many active signals are in play. We will then hold that amount of each total position.
3 Signal Plan
1. Price is above a RISING 20 WMA (1/3 position)
2. Relative Strength Breakout (1/3 position)
3. Price Pattern Breakout (1/3 position)
Each of these signals represent levels of strength and each is a
proven winning strategy vs "Buy and Hold" investing. They do of
course require attention and management however and that is what most people
are unwilling to do. If you are willing to put the time in and enjoy the "game", you will come out ahead of the rest.
The primary basis of the strategy alteration is to scale in and out of positions rather an an all in, all out method; you can also call this "trading around a core position". Basically we watch our 12 stocks, when a stock triggers one of our signals we make a buy. If that stock then moves ahead in the coming weeks and triggers another signal we buy more. What this creates is a situation where you are adding to winning positions as they grow stronger. Some people like to wait until thier stocks come down in price and they then add to it. But what this creates is a portfolio full of large losing positions and small winning positions. Think about it, if you only buy more of a stock when it is lower than your initial purchase, only your weakest holdings are large portions of your portfolio. Your winners are ignored and allowed to run on making a little bit, but nothing substantial. Meanwhile you are pouring money into losing holdings. You need to start thinking about portfolio management from the other perspective.
You want to buy more of your best positions as they continue to strengthen. That doesn't mean buying every new high the stock makes; it means as your strong holdings move forward and higher in price, they will set up new positive risk/reward scenarios and you increase your size as those new setups emerge.
At the same time if these signals begin to fail we reduce our exposure to the stock. As the stock weakens we sell off our positions as each signal fails 1/3 at a time. This again reiterates the previous theory, buy more of your best and get rid of the weak.
Lets take a look at each signal individually, so everyone has a very clear idea of what our buy signals look like:
Price Above Rising 20 WMA
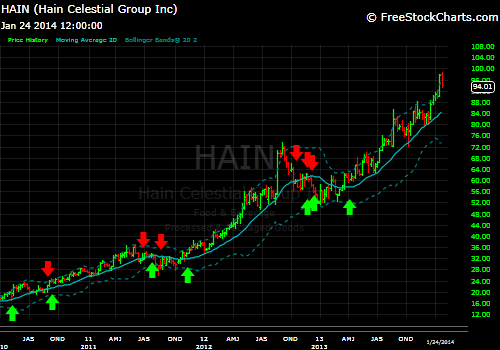
We will look at prospect HAIN for how the Rising 20 WMA signal works.
-Buy(green arrows) 1/3 total position when price closes the week above the 20 WMA while it is rising. We can reduce the "false signal" by waiting for price to make a new multi-week high confirmation.
-Sell(red arrows) 1/3 position when price closes the week BELOW the 20 WMA rising or falling. To reduce false signals we will use price support just below the moving average that will signify a real breakdown below the 20 WMA.
What this does is that it gets us into the stock when the intermediate trend is turning higher and gaining momentum, and it gets us out when any serious trouble presents itself. Trust me on this, you will never suffer through a bear market above the 20 WMA. This simple filter reduces your exposed risk significantly while positioning you for all potential upside moves.
Occasionally you will get a false signal and be what is called "whip-sawed". A Whip-saw is a situation where you get shaken out of a good position only for the stock to reverse and go right back in the prior direction. So it will create some frustrating moments, but do know your amount of risk vs potential reward is strongly in your favor. If price goes above the 20 WMA but the average is declining week to week, that is a false signal and is to be ignored. We only buy when the stock is trading above the RISING average and making new multi-week highs, signifying a resumption of trend.
*Note we do have an additional criteria for potential profit taking, if you are into that kind of thing.
-When a stock moves a certain distance above its 20 WMA, it is deemed heavily overbought and generally leads to a corrective period. Typically I have found that for most large cap stocks that distance is about 12-13% above the 20 average. This depends on a few factors but in general it is prudent to take gains at these extreme levels.
-Once a profit is taken, it is necessary to reenter the prior holding once price returns in line with the averages.
Relative Strength Breakouts vs. SP500

Here is a rough example of how you would have used RS Breakouts to trade AAPL's stock over the past 4 years.
-Buy 1/3 total position when a downtrending RS trend is broken on a closing basis.
-Sell 1/3 position when RS uptrend or horizontal support fails to hold.
Yes in hindsight its seems ridiculously easy, and it is. But in fairness and full disclosure I have traded this method in AAPL successfully beginning late 2012. I actually bought that surge right into the massive top when RS broke out of its 1-year sideways trend. I was stopped out rather quickly and for a small loss, but in hindsight this was my favorite trade I have ever made. And that trade was a sell after a small loss (I lost about 1.6%). AAPL was the coolest stock ever in late 2012, "you couldn't lose money by investing in it" was the thinking. This signal doesn't care about feelings and sentiment, it cares about rotating funds from strong to weak and vice versa. It signaled a sell and it was right. Everyone else who "thought" everything was fine lost 30% of their investment.
This position has since evolved into a fantastic winner for our Portfolio in the back half of last year and is still setup for continued positive risk/reward at this time.
Price Patterns

The final trading signal worth our while is a Price Pattern breakout.
-Buy 1/3 position once an established chart formation is setup and a breakout occurs.
-Sell 1/3 once price objective is acquired or pattern fails through protective stop.
Price targets are derived from measuring the height of the pattern and adding that amount to the breakout area.
Price Patterns are the most subjective of all the market signals, but they do have solid track records historically speaking. Being able to identify patterns in price action is a skill that is only gained from study of the markets. While as trivial as a price formations seem, patterns signal sentiment and trader's emotions. Humans tend to act a certain way in a repeatable manner when it comes to dealing with the emotions associated with fear and greed. These little behavioral patterns tend to manifest themselves in the price action. Its seems like witchcraft, and maybe it is, but it continues to work for me.
---
That's it. That's how we are going to attack all entries and exits going forward. We will manage our open positions based on these signals and will track all progress to see how each signal performed over the course of the year. My study of the markets has led me to these conclusions:
-you must have a plan
-your plan must be simple and unemotional
-your plan must skew risk/reward in your favor vs random events
-you must execute your plan...
-you must execute your plan!(this is really the hardest part of individual investing)
If you have a plan that puts your money in when the odds are in your favor more often than not, you are going to come out ahead. Your plan must be able to eliminate catastrophic loss to your accounts, it must also be able to minimize what losses you will face, and it must position you correctly when the market rallies strongly. If your plan can do most of that then you will come out better than most in the long run. I think we are very close to being at that level.
This week I will do my best to highlight each of our holdings (after i adjust our list to accommodate all groups) for the "signal score". Each holding will have a 0-3 out of 3 ranking. That will be based on how many active signals are currently in play. I will be using this coming week to prepare that list for you and position our Portfolio appropriately based on those signals.
No comments:
Post a Comment