There was not too much movement this week in the major averages as the S&P gained only 3 points. But still, the fact that we didn't see a quick move back below the upper resistance line is encouraging going forward. With only 2 months remaining in 2013, traders are gearing up for a highly anticipated year-end rally. Being that we closed another month, we need to take a look multiple time frames to put this rally in continued context with the bigger picture.
SP500 (daily)
Shorter term the market is holding its breakout very well and developing any downside momentum has been difficult for the Bears. With expectations into year end sky-high, it will be interesting to see if once again the market fools the herd and does something unexpected (when have we seen that before?). For the unexpected to happen however, first we need to see the uptrend channel resistance fail to hold as support here and we would then need to see the prior high from the breakout at 1,730 broken as well. As of now the thesis for a year end rally seems intact and above these levels we should expect higher prices.
The arrow in the above chart is pointing to the breakout gap that occurred when the market made a new high in early October. Gaps are caused by very high supply/demand imbalances that cause a stock to "jump" between trading sessions and typically act as a significant signal for the following move in the direction of the gap. Once a gap is created, that space will become a significant area of interest going forward. Markets tend to like to "fill" gaps and usually will trade back to where the gap occurred; these "gap fill" scenarios often create nice risk reward setups once the gap is filled. As you can see above, should the market trade back to the gap area it would also coincide with the prior high breakout level and the rising 20 DMA...Which would be a great, low risk place to put on a short term trade.
SP500 (Weekly)
The intermediate view of the SP500 still looks solid, although being above the upper channel boundary usually reduces the likelihood of a strong risk/reward for new intermediate term positions. If you are a weekly chart trader, these levels are good places to trim some solid gains and wait for a more favorable setup.
Something else that looks positive is the steady accumulation of shares trading hands over the past few weeks. Its a good sign to see new highs greeted with higher trading volumes. This alone is not a signal to buy these highs on an intermediate term, but it does show persistent interest for stocks at these levels.
SP500 (Monthly)
Looking at the long term view shows very strong follow through above the prior all-time highs since the breakout. This is very bullish action and suggests higher prices longer term. I am a bit concerned how extended current prices are above the 20 MMA, as we have seen in past rallies, an extension this high above the moving average tends to create a retracement back to the longer term average. And just for context, the distance price was from the key moving average at the end of October was the furthest we have seen at any point in the last 20 years! Extended? I say so. This market could correct over 260 points and still not even hit that 20 month average.
Bottom line, all these views show strong price action and that should not be ignored. However I am also seeing signs of a mean reversion situation evolving on the longer term charts. Mean reversion by itself is not a reason to get negative on the market, but it is something to keep in mind. By its very nature returning back in line with the trend average is a healthy and constructive process. We should not want or expect prices to continue to accelerate straight up as that creates unstable, bubble-like environments. If you are bullish the market long term (which from the price action perspective, you should be) you want to see a lengthy period of consolidation allowing the longer term averages to catchup. A meaningful pullback would get the Bears out in force, shake out a ton of speculative traders and give the move a sustainable base to continue on from
---
Here are a couple notable charts from our watchlist this week:
CMI
Cummins announced earnings this past week and disappointed vs analysts expectations; the stock was sold hard initially. Tuesday morning after the announcement, the stock was down nearly 10% at the open of trading. However the low of the day was set in the first 15 minutes and it spent the rest of the week rallying back to close just shy of the prior all-time high. What was also fascinating about the early selling was that it stopped right at our resistance turned support and prior breakout level. It also popped right back above the 20 WMA and held that as well. While its not the best thing when a company misses on its earnings, it is most important to know that there is significant investor interest for shares at that $122 inflection level. Tuesday's lows will now be our stop and will need to see that broken to signal our exit.
DDD
3D Systems continues to impress and after an initial stumble from a positive earnings report, the stock soared to a new all-time high and closed at the highs of the week. While it would seem logical that this would need to cool off a bit, there is nothing particularly logical when it comes to investor opinion on 3D printing potential. Since that support retest 4 weeks ago, DDD has set 3 new weekly closing highs and seems poised to continue higher. Any sort of multi-day weakness in this stock should be bought as the setup is very strong above the $52 level.
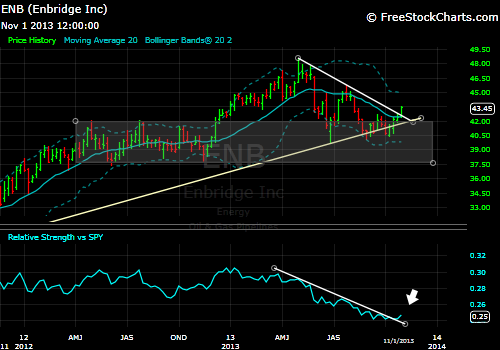
ENB
Enbridge is about as close as it can be to triggering an entry for us. We had a breakout from the downtrend resistance lines on both the price chart and Relative Strength chart. While the stock has been weak since April, we are now seeing the signs that the large support area below $42 will hold on this pullback. Also of note is that the long term uptrend support continues to hold. All we are waiting for now is for the 20 WMA to turn positive and confirm the trend change, which will likely occur on any positive follow through trading this coming week. I'm about 95% sure this will trigger an entry for our Portfolio this coming week and I will post any updates that may occur. Since we are waiting for a Weekly signal confirmation (20 WMA positive), we will not enter a position until the close Friday, so be ready for that if ENB interests you.
As for actionable setups this past week, that's about it. We continue to see our other watch list stocks either holding above or just below key signal levels:
- Ford is pressing on its 20 WMA after struggling at resistance
- AAPL is holding and consolidating nicely above the $500 level
- PBW has held its breakout this week
- WFC is holding just below downtrend resistance
- Even HD is trying to right the ship and turn around, but still has work to be done.
- Both HAIN and PPG continue to hold well above key support levels and are showing solid relative strength.
As far as the sector groups go:
-XLF is continuing to underperform the S&P and is stuck below short term downtrend resistance
-XLY, XLK, XLI, XLB, XLE, XLV continue to show positive strength and strong trends
-XLP, our most recent addition this past week, looks ready to continue to resume its strong uptrend.
-XLU just can't gather any real performance advantage vs the SP500 and will continue to stay on the watch list until it can prove money is rotating into the space.
That's about all I have for you this weekend. I will continue to watch these developments and key levels going forward and will be sure to let you know about any developments. I expect next week should resolve some of these key levels, so we will just have to see which way the market wants to take us in the coming weeks. As always we will be flexible and just take what we are given, we will not try to impose our feelings and emotions on the market, as it simply doesn't care how we feel.


No comments:
Post a Comment