Lets get started!
Enbridge

When you have a strong trend like Enbridge is in, you want to time your buys to when prices retest the uptrend support line. The arrows show the proper times to buy Enbridge for a longer time frame investor/trader. A shorter term setup is playing out from the 10 month sideways range breakout @ 42.00. The expectation is to see prices challenge the upper trend resistance. For disclosure, I have both longer term and shorter term positions in Enbridge.
Hain
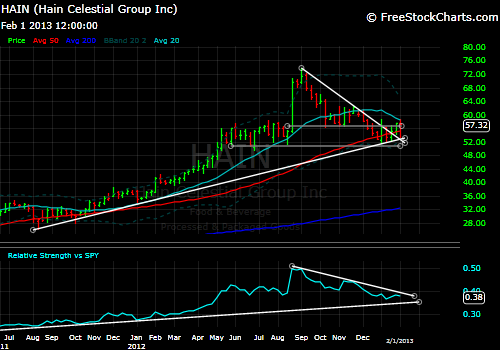
Hain is still in its longer term uptrend even after the 30% correction. The 2 year trend support is still holding and price has actually broken above the downtrend resistance. Something I think is very important to look at is a stocks' performance vs the SP500 performance, this is called "relative strength". That is the chart I am showing under the Hain price chart, and it has not broken its downtrend as of yet and is not confirming our breakout in price. We will reference this often as it is important to be investing in stocks that are performing better than the SP500. Otherwise why would we try to pick better stocks? We would just buy the SP500 fund. But we can use relative strength to find stocks that are beating the market. And that is our whole purpose...Outperformance!
For the record, HAIN has shown excellent outperformance over the past 2 years and will look to continue that trend with a breakout here. Earnings are announced Tuesday for Q4.
AAPL

How ugly can it get? What we are looking at here is the opposite of outperforming. AAPL is in a solid downtrend and has seen heavy selling volume for the past 3-4 months now. Also something I look for is the trending pattern of the 20 and 50 week moving averages (circled crossing each other). These are simply showing that the trend has shifted significantly and until that 20 Week Average begins to flatten out and turn higher you should not be buying this stock.
MOS

MOS broke above the resistance line last week and then tried to trade back below, but managed to close just at the major resistance level. This week I would hope to see the buyers come back in and push past the prior high from 2 weeks ago. Overall, the action we have seen recently in MOS has been very strong. Some consolidation at these levels would be healthy to see.
HD

HD took a breather this week after finishing higher the past four in a row. Maybe we get a quick pop to the upper trend line, then spend some time digesting the recent gains and holding above the new support level near $65. This chart, much like the one we see in ENB, has provided some excellent buying opportunities for longer term holders as well as a short-term opportunity from last weeks breakout above the range resistance level and the prior high. The projected price target for the range (blue horizontal likes) breakout coincidentally is the top of the channel resistance. As long as prices hold above $65, this thing continues to look great!
CMI

CMI stalled out this week after running into some overhead resistance last week. Its premature to get too serious about this yet, but its possible we are seeing the early formation of a Head/Shoulders Top (bad!). To eliminate the possibility of this pattern completing we would need to see price continue through the $118 resistance level and take out the prior high of ~$133. That would nullify the pattern setup and likely take the stock to test the upper channel line. Breaking $118 in the near future will be significant for this space. I trimmed my position in this stock on Friday of last week and am waiting to add shares back once we get above $118.
F

Ford has seen a great rally over the past 6 months and is now testing the (hopefully) new support area between 12.90 and 13. This week price broke through the level briefly (likely shaking out some weak holders of the stock) but then was able to come back above $13 and hold as of Friday's close. Once a stock begins to change trend it will typically "throwback" to the prior level to retest the new support. What we then like to see is for prices to hold right near the zone and see buyer interest return to the stock. This is very typically bullish behavior and as long as we are above $13, this is a strong entry point. If prices next week should fail here, the next level of support would be right around the $11.50 area. That's where the 20, 50 and 200 moving averages all are, as well as a prior inflection point for prices going back to mid 2011.
WFC

Wells is still clawing higher here. Something I think is important will be the resolution of this triangle formation (lower highs and higher lows create 2 converging trendlines, and the break of one of those lines will tend to dictate the near term direction for the stock). I have been steadily buying this stock in its recent uptrend, if it breaks above the downtrending resistance, I will be looking for more opportunities to add further. If it fails and breaks below the uptrending support, I will sell my position and wait for a better entry point.
PBW

Our clean energy fund has been moving in the right direction. It has been working sideways for a month now after the big surge from the November lows. While the short term action has given us a nice bullish Flag pattern, the longer term is setting up to move on an even larger pattern. The most notable pattern I see here is the Cup/Handle type pattern (highlighted by the green lines) price tends to form a bowl shaped "cup" followed by a consolidation "handle", then price should break above the resistance level and continue higher. However I could also see the setup for a possible Inverse Head/Shoulder pattern here if price pulls back a bit before continuing higher. Both patterns measure to the same price target, as you take the low from the "head" or 'Cup" and the highs from the resistance "neckline" or cups brim; you take the difference between those distances and that projects upward from the breakout/resistance area. In this case giving us a possible upside target of about $5.58 or about 25% gain.
I will try this week to put up a lesson on common price patterns and how we use them in building our investment plans.
DDD

3D Systems took it on the chin this week dropping some 15% on heavy trading volume. I posted about this pullback early last week and not much has improved. We normally like to see pullbacks, but violent moves like this are not typically very healthy signs in the near term. In this case, if we are taking a longer term view, I think this has a ways to come down until it is legitimately buy able. Short term there may be a trade to be had but longer term, we need to wait for this to cool a week or two. And yes it might just snap right back and continue ripping higher, but we are looking for low risk/high reward setups, not every maniac rally that we see. Long term I think this stock goes higher eventually, but right now we should let it play itself out a little more.
No comments:
Post a Comment