Tuesday, October 30, 2018

Lots of Support Lingering (Updated)

Back in late-October I posted some influential company charts and major support levels that were being tested. As we approach the end of the year I wanted to update those charts to see what has changed with regard to these market influencing companies.

Previous comments from the original post will be in [brackets] 

[I have been beating the drum of patience and caution recently. Today I am keeping an open mind and just looking at some prominent names from our watchlists and portfolios that are currently sitting on what appear to be major support levels]

UNP 10/29/2018

UNP current- The stock has bounced around but has basically gone nowhere. Although now it is below the 200 Day SMA and potential Head/Shoulder Top formation setting up. $136 is key support

UNH 10/29/2018

UNH current- Now testing the 200 Day SMA for the first time since early in the year. Price continues to hold support for now.

FANG 10/29/2018

FANG current- Major support breakdown and set to invalidate the Monthly trend at the close of Dec

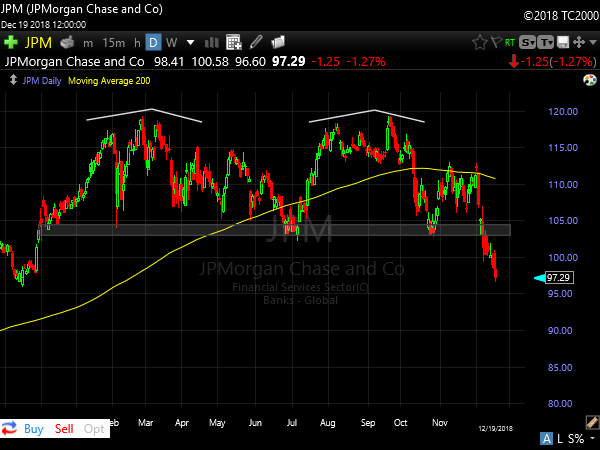
JPM 10/29/2018

JPM current- Double Top triggered after a bounce into the falling 200 Day SMA. Trend failing
FIBK 10/29/2018

FIBK current- Breaking major support. Oversold near-term, but below $38 is bearish

HD 10/29/2018

HD current- price has chopped around with little progress and is now back testing the major support

QLYS 10/29/2018

QLYS current- Price has held support and built a base. But now looks to be struggling at the 200 Day SMA and could trigger a large Head/Shoulder Top if it can't hold the $70 level.

AER 10/29/2018

AER current- After a bounce to the 200 Day SMA, price has broken support and looks like a Head/Shoulder Top in motion now. Very oversold near-term but price below $49 is bearish

ILMN 10/29/2018

ILMN current- Continues to hold support and the 200 Day SMA

TWTR 10/29/2018

TWTR current- Price holds well and made a higher swing high recently, yet it is struggling with the 200 Day SMA.

ALRM 10/29/2018

ALRM current- Recovered well from the initial plunge but still struggles with resistance. Still an intact trend for now.

FFIV 10/29/2018

FFIV current- Price is breaking below the 200 Day SMA and support lows. This looks like a Head/Shoulder pattern in motion.

GWPH 10/29/2018

GWPH current- Price has failed major support and is now rolling lower

M 10/29/2018

M current- Price is sitting just below key support and breaking below just in the last couple of days. Note the stock continues to hold the gap area from May and filled the gap early this week.

JAZZ 10/29/2018

JAZZ current- Failing the large support area

GBCI 10/29/2018

GBCI current- After rallying strongly to new highs the stock has fallen -18% in 12 trading sessions. Now it is approaching major support once again.

CIEN 10/29/2018

CIEN current- Price has performed well despite this poor market. Good leader here

[These patterns can go one of two ways: Either we see support hold and this could be a tremendous buying opportunity OR support fails and in that case many of these look like massive topping formations.

With the size of correction many of these names have seen recently there is likely a strong relief rally ahead. Using this support as the basis of that thesis could prove a strong risk/reward. 

I am a big believer that we don't need to be the first ones in on a move to make money. There is very little reason to shoot from the hip trying to catch a low that we "hope" holds. Instead I prefer to watch the price action, identify key levels of interest, and wait for confirmation.

If prices can hold this support we will likely see new rotation patterns trigger that we can trade for a pop. If prices fail these levels then it is likely we are headed for a more serious downtrending market. Some big names have already failed key supports, most notably Semiconductors as a group (SMH). We will want to see the remaining support levels above hold if the Bulls want to push for a year end rally.

Keep these levels in mind and trade what is actually happening in front of us rather than what we want to "think" should happen. Be ready for either outcome from here and keep an open mind.]

*The updated looks of these charts for the most part show degradation with the exception of a couple. The concerning thing I see is that despite the poor market and current correction depth, we are still seeing fresh breakdowns of large support in many of these names above. This would suggest plenty more downside could be ahead for the market overall.

To reverse this negative outlook we would need to see prices move back over the broken support levels and start to make higher swing highs

Friday, October 26, 2018

Bank Patterns Point to Intermediate-term Top

The look of some of the larger Financial stocks are suggesting more downside ahead and a likely intermediate Top for the market.

WFC
2-year Head/Shoulder Top pattern. To trigger this would need to break $50. The measured target should be near $35.

USB
2-year Head/Shoulder Top forming. Breaking below $49 would confirm this pattern. The measured move suggests an objective of $40.

GS
2-year Head/Shoulder Top. When Goldman struggles, Financial stocks likely struggle.

KRE
Regional Bank ETF looks to be in the process of possibly forming a larger Top pattern. Over the last year KRE has formed a confirmed a Head/Shoulder Top pattern. It should be noted this achieved its objective and is now at prior support.

It is possible this recent correction back to the prior lows could setup a larger Head pattern. A subsequent rally from this oversold condition could create that major lower high and look quite ominous. I will be monitoring this going forward.

The patterns in Bank stocks look to suggest a bigger problem ahead for the market. At the very least they suggest taking caution in our investments, raising more cash is my ongoing objective until this situation resolves itself.

Coming out of 2016 I was very bullish on the Banks. We did great through 2017, but 2018 has been a different animal. They have been frustrating to own and very volatile, especially considering we are "suppose" to be in the ideal environment for these companies to perform strongly.

The price action is not lining up with the common thesis revolving around Interest Rates and the economy. When the reality of the market action and "opinions" are on opposing sides, I go with the market 100% of the time.

p.s.
XLF is showing Relative rotations away and more into Consumer Staples (XLP). This suggests a cautious posture from large Institutions. Momentum is also showing a trend change after over 2-years of "uptrend" behavior. Failing below the Zero-line shows a shift in trend, at best it marks a period of choppy consolidation for the intermediate-term.

Friday, September 14, 2018

Did OXY Just Bottom?

I'll let you draw your own conclusions:

OXY Quarterly
Long-term we can all agree that the stock is in a strong uptrend. Yes it has been correcting for over 6-years and -50% off the highs

OXY Monthly
It appears a 3+ year Inverse Head/Shoulder pattern has triggered and now the neckline is being retested.

OXY Weekly
Price has pulled back in a Bull Flag type pattern and this week undercut the prior swing low in August. The stock reversed significantly into the end of the week and closed with a "Hammer" bar.

OXY Daily
On this recent decline price has come back to clip the 200 Day SMA and reverse back above. With the new low in price we did not see a new low in momentum. Price has also been trading with a rising 200 Day SMA since late-2017.

On the Fundamental side the company currently pays a 4.02% Dividend, grew EPS Q/Q by +66%, grew Sales by +35%, and is expected to grow EPS by +68% over the next 5-years.


Monday, July 9, 2018

Fractal Pattern in SP500 Suggests Strong Upside Potential

The current Weekly chart formation and break higher appears to be a fractal pattern of the post election Monthly chart in 2016.

SPX Weekly


SPX Monthly November 2016

Obviously there are differences in exact pattern but the overall structure is quite similar.

Both consolidation areas are roughly 20 bars, broke out of a flat base resistance, and pulled back to retest the breakout level + 20 SMA before rotating higher.

From this formation we know prices can run significantly as we saw in 2017 following this November breakout. I am not ruling out the possibility of a strong push higher from the current Weekly basis pattern either.

Monthly patterns are more explosive than Weekly patterns, but we could still see significant upside from here provided price holds last week's low and rotation point at 2,690

Sunday, July 1, 2018

Some Miscellaneous Charts at the Close of Q2

Whether you trade long-term charts or not I feel it is very important to keep perspective on the larger timeframe to best understand the market you are trading. We want to be aligned with the dominant trends. Knowing these larger perspectives can also guide us to building a bigger thesis on how we want to position funds or focus on opportunities going forward.

I spend a lot of time looking at and positioning with Monthly charts. Even taking some time to look at Quarterly charts can give us a viewpoint that is simply hidden to most participants. I believe there is great value in looking where others will not. Zooming out to view the forest instead of obsessing over the trees is something I take very seriously.

EEM Quarterly
Emerging Markets have been taking a lot of heat in the media lately, but I think they are the most interesting that they have been in the last decade right here.

After ripping for the last 2-years off the 2016 low, price has now retraced to the downtrend breakout line and approaching the now rising 20 Quarter SMA.

This group has been an absolute mess for a decade and I have had no interest in getting involved. The only opportunities they has offered have come from 2 vertical runs off of price crashes, not exactly ideal for a trend following strategy. In fact the return would be zero had you just held this from early 2007.

However it looks like the character is changing here: momentum is rounding up after a move back to the Zero-line and price is retesting multi-year breakout resistance going back to 2012.

XRT Quarterly
Retail stocks have been the whipping-boy of many trading discussions over the past couple years. The overarching reasoning is that AMZN is simply killing the entire retail industry. For our purposes we should note that AMZN is actually in the XRT, so that helps.

But overall the so called demise of the Retail sector seems greatly exaggerated and concocted by those who can't see further out than 1-year of price history. Certainly they have underperformed during this latest bull run, however the long-term view looks to be setting up after having rested in a very orderly manner.

To me all this looks like is a 3-year consolidation at all-time highs after a 6-year run from $7 up to $50. It looks quite normal to me and I would expect the trend to resume in the prior direction once this rest period comes to an end (which appears to be sooner rather than later).

This is a group I want on my radar going forward and will be open to building positions as opportunities arise.

XLE Quarterly
Energy has the look of a very coiled chart that is trying to break out. After the bear market run through 2015 price is now testing the key $80 level.

I note that momentum has rested back to the Zero-line for the first time in this ETF's existence which is often an indication of a powerful coiled spring.

Should prices clear this $80 resistance I think a test of the prior highs at $100 would be an easy target and would be looking for substantially higher prices from there.

This group is showing very strong EPS projections going forward and I want to be a buyer on new opportunities that arise over the next few quarters.

TLT Quarterly
Treasury Bonds continue to look like a top to me and this long-term perspective shows that structure.

There is a clear Head/Shoulder Top pattern (trust me, when you can see a Head/Shoulder pattern on a quarterly chart, its a BIG pattern). Momentum is dragging downward and looking poor.

This is a big picture thesis I have and will continue to reference this chart to see if it continues to play out.

TNX Quarterly
The 10-Year Treasury Yield appears to have formed a successful Double Bottom pattern. Note the momentum divergence on the recent 2016 low, a very powerful shift in momentum is occurring and price is responding

 Remember this is a big picture view and concerns itself very little with the weekly squabbles on CNBC about any particular level on the 10-Year.

Long-term it is clearly the case that Yields have bottomed and I will stick by that thinking until something changes on this timeframe. I don't give a crap is the 10-year goes to 3% and then back to 2.5%, it matters not to this thesis.

GE Monthly
This is strictly a speculative "value" type play and not my normal strategy, but I can't help notice what has occurred on the Monthly chart to close June.

Price has obviously poured over like a waterfall in the past 18-months; this thing is a total dog, you can't even trust the dividend any more. But what I am seeing here is at the very least interesting.

I notice how price clipped the lows from March and April and then recovered swiftly to close well back above that level. I'm not trying to call THE bottom in GE but the risk/reward is appealing for at least a mean reversion trade.

Prices don't trade in straight lines forever, they always revert to the larger trend average eventually. Currently price is 66% below the 20 Month SMA. For a lumbering mega-cap like GE that is an unsustainable discrepancy. So either this thing is going absolutely to zero or will recover at some point soon.

The way I see GE is this: We have a confirmed Monthly reversal of the prior lows, I will place a stop at the June low and see if this can retrace to the 20 Month SMA. If assuming it takes about a year for this to play out I would expect the 20 Month line to come down a couple dollars from its current levels and be around $20ish. That gives at least a 6-1 reward to risk.

I like to take long-term speculative trades when the opportunity is right and I think there is opportunity here.

OSTK Monthly
OSTK is a very wild trader, so this is a highly speculative trade idea as well. The price structure is interesting here. For a decade this stock has built out a large Inverse Head/Shoulder base pattern. Over the past year we have seen price explode higher out of that pattern to new all-time highs on monster trading volume.

Since that breakout price has retraced back to test the rising 20 Month SMA and prior highs of the range. Also note that in June the stock broke below the prior 2 monthly lows and the 20 Month SMA only to recover those levels prior to the close of the month. This looks like a decent shakeout and the stock could be ready to resume higher.

If this is a Bull Flag pattern (which I think it is) then we would expect prices to retest the prior highs near $90 (nearly 200% from current levels) and then eventually resume to new highs and extend much further.

I want to be looking for opportunities in this name as long as price is above the June lows. This thesis will gain much more momentum if price can clear the 3 monthly highs sitting near $41.50.


Monday, June 25, 2018

BABA at Key Support

BABA Weekly

 There have been a whole lot of eyes on BABA lately and on the move to new all-time highs in early-June. I've been hearing many bullish calls for higher prices, breakouts, etc. I don't disagree with this thinking but just likely on a different path than most who were making those calls. 

BABA has gone on a beautiful run over the last 2-months, rallying 8 straight weeks from the range lows to new highs. These kind of strong and persistent moves tend to attract a lot of attention, especially near the end of the near-term run. 

There will no doubt be talk today of a "failed breakout" due to the drop it made off the highs. However I feel this is EXACTLY what is needed before prices can resume higher in any meaningful way. The market loves to fool the majority and will most often shake out the bullish excess of a recent rally before resuming back higher. 

What I have had in mind for a more preferable setup vs just buying into the extended run was for a pullback to occur on the weekly chart that breaks back below the prior highs. Today we are getting exactly that. 

The Weekly chart above is now showing a textbook pullback or Bull Flag to the rising 20 Week SMA as well as filling the open gap from 5/4; this is my bread-and-butter setup. 

The confluence of support on the larger timeframe in my view overrides any "false breakout" on the Daily chart. I always yield to the higher timeframe structure and in this case the difference between the shorter-term and longer-term bias is quite pronounced. 

The fact that most short-term traders are now bearish is a good sign for the longevity of the larger timeframe trade. 

As of now this is just the initial pullback or the setup; the price action has not confirmed a verified pivot yet. For me that means buying only a partial position here on the support and then waiting for a rotation up on the Weekly chart. This will likely take a week or two to develop further.  


Saturday, June 9, 2018

Trannies Ready to Show Their Stuff

The Transportation stocks are lining up on multiple timeframes to make a new leg higher it would appear. As market participants we know that a strong economy and by extension, a strong stock market should see shippers and carriers performing well. 

If Train and Freight companies are delivering products in high quantity, it means companies that sell those products are seeing high demand from consumers spending discretionary income. All combine to suggest a strong underlying demand for goods and services we need or want for our daily lives.  

It is my view that the Transport stocks are on the cusp of extending their rally significantly in the near future.  

Monthly
The long-term view of IYT has the look of an orderly consolidation after strong 2016 and 2017 rallies. Price extended up to the 161.8% Fibonacci level of the 2015 bear market decline and has since moved sideways to let the 20 Month SMA catch up to price.

Should we see a resumption of trend above the $200 level, the next extension area sits near $250+.

Weekly
The Weekly chart shows price holding firm in a range just above a multi-month resistance area. This is setting up a 3x Weekly High breakout potential should we see price move through the $198 level.

A breakout here brings the prior highs into play quickly

Daily
The Daily chart zooms in on the 4-month trading range. Note the gap resistance from late-February right near $198. This resistance has contained prices the entire time, but the behavior of the near-term action is changing.

There have been multiple tests of the higher end of the range. Those rally attempts were all rejected sharply and prices moved back to the support lows. Since the end of May sellers have not been able to reject prices as they did previously, this to me shows a strength.

It appears the sellers are wearing out and an upside resolution is imminent.   

A couple names we hold in our Model Portfolios at zentrendstrading.com are UNP and ODFL.

Note that these leading names in the Transport group have already broken through their resistance and retested the area as support. Prices are now responding higher off of that retest.

UNP

ODFL

We must always remember that a Sector or Index is not an entity on its own, but rather a group of individual underlying stocks. If these stocks are breaking out and leading the group higher, the odds increase that the Sector or Index will follow closely behind.

If you have interest in learning how to identify and manage this kind of multi-timeframe investing, please visit us as zentrendstrading.com.

We provide detailed Notes, Videos, and ongoing dialogue for our positions allowing members to follow along with our trades. Our process is designed to take advantage of large swings that occur in the market without having to sit in front of your computer all day long. 

For questions or comments please contact me at cody@zentrendstrading.com or on Stocktwits/Twitter @ZenTrends