I have been very cautious in the market over the last 2 months. I've taken plenty of new Longs in early January and have been running them, but with hedges on as the market was in a dangerous posture following the October drop according to my trend health metrics. Capital preservation has been very important to me. For the most part our positioning nailed it from late-October through Christmas Eve. It is everything since that has been much more difficult.
However, January put a stall to the decline, posting many Inside Months. February is looking like strong follow-through higher from that consolidation. Many individual growth stocks are doing very well and the indices are moving right back above longer-term trend averages.
I am a hybrid Swing/Trend trader, with a bit of William O'Neil CANSLIM in there as well and I invest a significant amount of my assets in growth stocks on a much longer timeframe. Based on the longer-term models (which have held up great overall during the correction), Bull signals are triggering all over the place.
I get it: overbought, resistance, macro, Trump, China, The Fed, whatever...
And I agree with all of that 100%. I see it too. Based on timeframe, I am adjusting to the current position we find ourselves in. The market should pullback, yes it should. But it might not...that is a possible outcome as well.
My longer-term models do not recognize most of the above mentioned biases as inputs for buying and selling. There are signals based on Price or there aren't, its as simple as that.
Thursday is the close of February and therefore the close of the monthly bar. Despite all the reasons above to ignore my models, I will push forward and take 4 new positions for our longer-term accounts, bringing that exposure up to about 85% Long: SPSC, MKTX, BOOT, INTC
SPSC Long above this breakout
MKTX Excellent Trend Following entry, Long above the new pivot low
BOOT multi-year post-IPO base, Cup/Handle, Bull Flag, whatever you want to call it
INTC Bull Flag and 6-month highs breakout
SPX While the short-term is very overbought, the larger view is just rotating out of a fresh pattern now. A lot like March 2016
I also like SMH, XBI, XLY, and XLV for ETF accounts.
I admit when I am wrong and turn with my models. Sometimes my models are wrong, maybe they are wrong this time. They weren't wrong in 2016, they weren't wrong in October. I'll stick with it...But I can feel the hate.
ZT
Wednesday, February 27, 2019
Wednesday, February 13, 2019
Sector Groups in a Tight Spot
I have always deferred the majority of my market analysis to the Weekly timeframe. I feel that making too many decisions based on one day's worth of news or price movement tends to be reactionary and also leads to many false signals. When you wait for the Weekly chart to close there is a lot more information that has been uncovered, analyzed, and absorbed. The signals that tend to follow this larger interpretation of data and sentiment I find more reliable.
There is a lot of talk daily about this market recovery; there is talk about the 200 Day SMA, each day's movement, individual earnings reactions, etc. There is a hyper-awareness by the majority of market participants and Financial Media to the "hot story" of the day. But rather than taking this tunnel-vision approach, I find it much more telling to step back and observe the larger context of this rally to assess the overall trend health.
Financials XLF- Rally back to prior failed support and into falling 20/50 Week SMA's. Usually this is a poor risk/reward setup for a bullish bias.
Consumer Discretionary XLY- Pushing through falling weekly SMA's, still lower low/lower highs
Industrials XLI- Powering right through prior failed support and clearing weekly SMA resistance. Moving above the December high is notable strength. In position now, due to significant strength, to form a higher low and possible "right shoulder" for new Inverse Head Shoulder pattern on a pullback.
Materials XLB- Soft recovery and still decently below prior broken support level.
Energy XLE- Rally back to falling 20 Week SMA and lower boundary of prior trading range
Health Care XLV- Trading above weekly SMA's while 50 Week SMA still rising (uptrend). One of the better looking groups overall during this corrective period.
Consumer Staples XLP- Long-term trading range, price has recovered back above weekly SMA's.
Utilities XLU- Pressing near all-time highs, weekly SMA's are rising suggesting uptrend behavior
Stepping back and observing the bigger picture this looks like a very mixed structure. Prices have rallied a ton over the past month and a half. Many trends remain pointed lower and those that are looking strongest tend to be more Defensive in nature (XLV, XLP, XLU).
Financials lagging is a bit of an issue for the Bull case, but the potential for Semiconductors and Industrials to reclaim broken support and form higher lows could be enough stabilization for the market to gain some structural footing.
We won't know what we really have in terms of a healthy recovery until we see a multi-week pullback/digestion. How participants respond to some bad news and poorer price action will be very important to watch. Do they just dump everything and assume this was simply a trade-able bounce, or do they come in with sidelined cash to support the market and set a higher low?
Keep an eye out for those higher lows to form. That will be the best indicator we have and requires zero outside "noise" to decipher.
There is a lot of talk daily about this market recovery; there is talk about the 200 Day SMA, each day's movement, individual earnings reactions, etc. There is a hyper-awareness by the majority of market participants and Financial Media to the "hot story" of the day. But rather than taking this tunnel-vision approach, I find it much more telling to step back and observe the larger context of this rally to assess the overall trend health.
Financials XLF- Rally back to prior failed support and into falling 20/50 Week SMA's. Usually this is a poor risk/reward setup for a bullish bias.
Technology XLK- Into weekly SMA resistance, still lower low/lower high for now
Semiconductors SMH- Pushing right through prior failed support and weekly SMA resistance. Enough space is being created above the 20 Week SMA to setup a possible Bull Flag on a digestion of this rally, while the moving average should turn up under price and could become supportive. Above December high is notable strength. Next we look for a higher low to form.
Materials XLB- Soft recovery and still decently below prior broken support level.
Energy XLE- Rally back to falling 20 Week SMA and lower boundary of prior trading range
Health Care XLV- Trading above weekly SMA's while 50 Week SMA still rising (uptrend). One of the better looking groups overall during this corrective period.
Consumer Staples XLP- Long-term trading range, price has recovered back above weekly SMA's.
Utilities XLU- Pressing near all-time highs, weekly SMA's are rising suggesting uptrend behavior
Stepping back and observing the bigger picture this looks like a very mixed structure. Prices have rallied a ton over the past month and a half. Many trends remain pointed lower and those that are looking strongest tend to be more Defensive in nature (XLV, XLP, XLU).
Financials lagging is a bit of an issue for the Bull case, but the potential for Semiconductors and Industrials to reclaim broken support and form higher lows could be enough stabilization for the market to gain some structural footing.
We won't know what we really have in terms of a healthy recovery until we see a multi-week pullback/digestion. How participants respond to some bad news and poorer price action will be very important to watch. Do they just dump everything and assume this was simply a trade-able bounce, or do they come in with sidelined cash to support the market and set a higher low?
Keep an eye out for those higher lows to form. That will be the best indicator we have and requires zero outside "noise" to decipher.
Wednesday, January 16, 2019
Bases
There appears to be a growing number of stabilizing support patterns emerging in many individual stocks
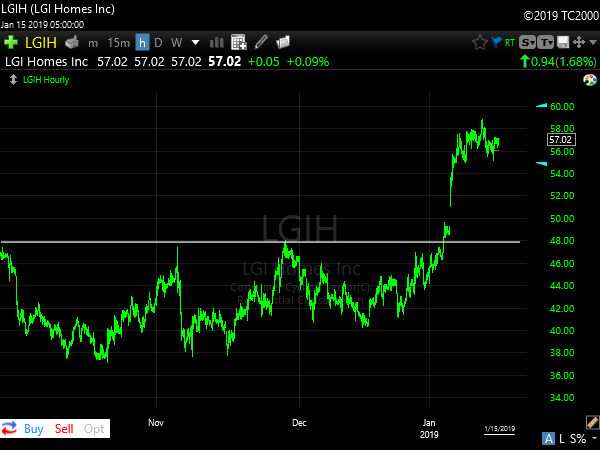
Regardless of what we think the market "should" do or will do next, observing what is actually happening will likely be more helpful than guessing. How the stocks below resolve these patterns will likely be the leading indicator for the overall health of the recovery.
PYPL
AAXN
ALRM
AMZN
FSLR
FTNT
LGIH
LNG
LULU
MA
PANW
QLYS
TDC
VEEV
VNOM
WYNN
Regardless of what we think the market "should" do or will do next, observing what is actually happening will likely be more helpful than guessing. How the stocks below resolve these patterns will likely be the leading indicator for the overall health of the recovery.
PYPL
AAXN
ALRM
AMZN
FSLR
FTNT
LGIH
LNG
LULU
MA
PANW
QLYS
TDC
VEEV
VNOM
WYNN
Friday, January 11, 2019
Longer-term Holdings
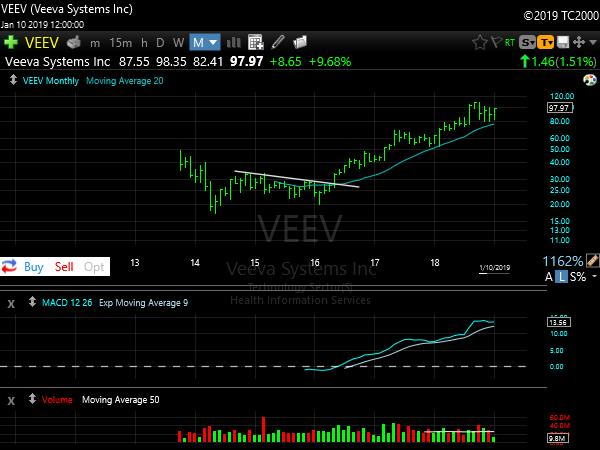
Our longer-term holdings don't look all that bearish despite the market correction. Overall we are positioned in tremendous growth names, within rising trends (many just emerging). The correction has allowed many to cool off after big moves in 2017. This pause is normal and welcome as it will eventually allow us to trail stops higher.
Lets take a look at our Longer-term positions
REGI
VEEV
ILMN
ALRM
SBUX
AMZN
QLYS
FTNT
PANW
VNOM
TWTR
CRCM
PRMW
SQ
JWN
I definitely have a "type" when it comes to our stock picks. Almost every single one of these stocks is acting in an uptrending manner. The pullbacks have been orderly and still within the bounds of normal trend reversion. In fact I believe these are incredibly bullish setups that can be added to soon if the market cooperates.
Even our worst position currently, JWN is still not quite dead yet. JWN is trying to hold support and this higher low.
Zooming out these charts gives a lot of perspective that is lost in the daily hullabaloo of news, politics, social media, and algo-generated volatility. But if you take a step back, I feel it is a clearer picture for separating those that hold up better and are on a stronger platform to launch the next move from, rather than trying to stab at laggards or hold positions that are simply not acting well.
The key next will be to see if prices can rotate back higher and resume the prior uptrends. So far I am treating these digestions as Bull Flag patterns within the bigger picture.
If you are interested in what we do at zentrendstrading.com, feel free to come check us out.
Lets take a look at our Longer-term positions
REGI
VEEV
ILMN
ALRM
SBUX
AMZN
QLYS
FTNT
PANW
VNOM
TWTR
CRCM
PRMW
SQ
JWN
I definitely have a "type" when it comes to our stock picks. Almost every single one of these stocks is acting in an uptrending manner. The pullbacks have been orderly and still within the bounds of normal trend reversion. In fact I believe these are incredibly bullish setups that can be added to soon if the market cooperates.
Even our worst position currently, JWN is still not quite dead yet. JWN is trying to hold support and this higher low.
Zooming out these charts gives a lot of perspective that is lost in the daily hullabaloo of news, politics, social media, and algo-generated volatility. But if you take a step back, I feel it is a clearer picture for separating those that hold up better and are on a stronger platform to launch the next move from, rather than trying to stab at laggards or hold positions that are simply not acting well.
The key next will be to see if prices can rotate back higher and resume the prior uptrends. So far I am treating these digestions as Bull Flag patterns within the bigger picture.
If you are interested in what we do at zentrendstrading.com, feel free to come check us out.
Subscribe to:
Posts (Atom)