It is an incredibly positive practice, good for the soul and the heart, to once in a while look at some chart porn. CHART PORN!? What the hell is that? Once you see chart porn it will change your perspective forever. Most every stock chart you will see will have distracting stuff all over it: indicators, lines, price containing bands, boxes, colors, you name it. It's very prudish chart dress up if you ask me. What we really want are charts exposed, in the nude, with nothing on them...You know, chart porn.
When all you have is price by itself you are left with the pure, unadulterated trend and direction. When there are channel lines and momentum indicators on your charts, you will have biases to your analysis. "Well I can't buy this breakout signal, there's a channel line there", or "that tanking stock has positive momentum, I should buy it". Whatever the setup shows, your perception of the price will be altered by the indicators. Not to say that those things can't be helpful, because they certainly can (in small doses), but price trend is still the most important factor and sometimes that gets lost in search of the magic indicator.
So lets get to it! Lets look at some chart porn!
For the sake of this exercise we are going to look at 1-year, daily bar charts to make sure we are seeing the most recent and relevant price trend. It is a good idea to look at all perspectives and time frames, but for everyone's patience and attention I'm just gonna stick to one, intermediate term view. We will look at the Sector groups this week and next week we will look at our Top 10 stocks.
---Note: erasing old lines and stripping your charts bare, will prove helpful for practice in identifying support/resistance levels and possibly open your view to some things you may have missed by only focusing on older trend lines and levels. Markets are always changing and evolving, so its a good idea to wipe the slate clean from time to time and redraw the most relevant levels.
SP500
So here is a full nude of the SP500 index for the past year. This will be the primary comparison chart for the rest of our trends. We are looking for higher highs and higher lows, steepness of trend, new highs, and breakouts. As you can see by looking at the SP500 price movement here we have higher highs and higher lows (uptrend), about a 45-55 degree slope (45 degrees is steady and sustainable), there are certainly new highs being made in the last surge, and a new breakout that has so far held.
Picture perfect, yes? Now we will compare this chart to the 9 sector groups that comprise the SP500 and see how the Offensive groups stack up vs the Defensives.
Offensive Groups
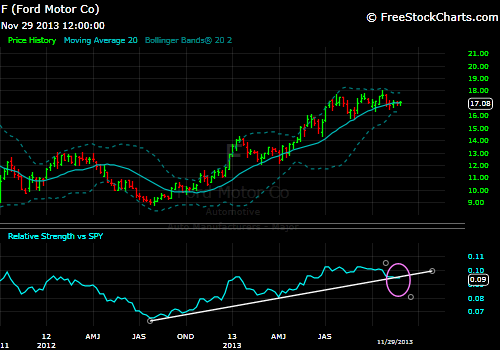
Financials (XLF)
The XLF was nearly identical to the SP500 through the August peak. Since that point however they have failed to reach new highs on subsequent rallies. The one main thing that stands out to me still though is that no new low has passed the previous low, therefore the primary uptrend is still intact. Relative strength is lagging by not being able to reach new highs along with the broad market, but a breakout above the $21 highs should confirm higher prices to come. If the XLF can take out those highs, I would expect another leg up in this rally.
Discretionary (XLY)
This is what a true leader looks like! Discretionary has been just humming along, look at that uptrend. New highs on each rally and a very strong breakout above the prior highs. This is still the front runner for sector of the year in my mind. I had and do have a lot of exposure to the XLY stocks; I think they represent the most constructive sector in the market.
Technology (XLK)
Tech has come on strong over the past six weeks or so. Price has maintained an uptrend throughout the year, but only recently has the group been leading the market. For almost the entire up move this year, Tech leadership was largely absent. I am of the belief that Tech could really make a strong push from around these levels and lead the market in a year end rally. The gap and go breakout in mid-October looks strong for the near term prospects of the group.
Industrials (XLI)
Industrials have been great. The relative strength of the group has been very strong since May when they experienced a gap and go breakout. There was a nice correction after that strong initial rally (it filled the gap from the May breakout almost to the penny), but that just set the stage for an even stronger leg up from July to November. New highs, higher lows. This is a winner.
Materials (XLB)
Materials keep looking like they want to do something big, but are sure taking their time getting there. They are still holding up fine and performing in line with the S&P. We certainly have a decent uptrend and after seeing strong action on Friday, I hope this will step up the pace a bit. The rally from October, that has now slowly corrected, looks to have formed a bull flag pattern and a break above $44.40 would set up another leg higher.
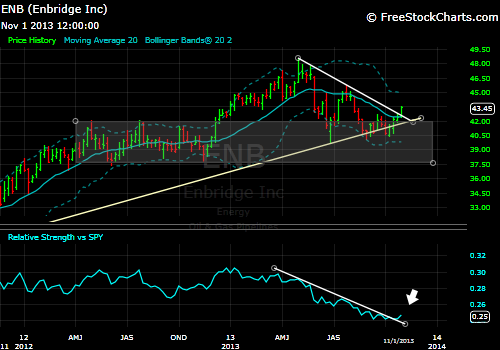
Energy (XLE)
Energy is in the same boat as Materials. Every time you think its about to start moving again, it stalls a bit. Its a choppy uptrend, but we still continue to see new highs none the less. Even though its been sloppy recently, you could make the case that it too is setting up a bull flag type pattern and is looking to extend its new highs streak a little longer. With oil coming down in price pretty drastically over the past two months, I think its due for a bounce, which would also help the group as a whole push to new highs.
------
Defensive Groups
Health Care (XLV)
The strongest of the Defensive groups, Health Care has been a source of market strength all year long. It has consistently made new highs and is holding its most recent breakout very well. I have been seeing a lot of the individual names within the XLV show strong breakouts as well. This still looks like a winner.
Staples (XLP)
The Staples have underperformed significantly since topping out in May. The first half of the year run was epic; there were barely more than a handful of down days over a 6 month period! But since that rally, price has really consolidated those gains and took a lot of the froth out of the group. As we have discussed recently, the XLP looks to be signaling that it wants to continue it previous move higher from this long sideways base. The breakout over the last couple weeks has held and as long as prices can hold these new highs, this thing has a chance to duplicate its January-June momentum.
Utilities (XLU)
Utilities look like an even sloppier version of the Staples. I actually got a false entry signal in XLU on Thursday, but then promptly exited the position at the end of the day Friday, when my breakout signal rolled over and failed. I think these are close to setting up a nice risk reward, but its still just a bit too soon to get fully on board.
20+ Year Treasuries (TLT)
As the primary "anti-stocks" asset class, long term Treasury Bonds have been slaughtered all year. The only meaningful rally occurred over a 2 month period from March to May, but certainly has the look of a secondary move against the primary down trend. The consolidation from August to now has a very similar feel and Friday's gap down through the short-term uptrend support shows more weakness is likely. This could be setting up two bearish looking patterns. The most recent bounce looks to have formed the flag portion of a continuation bear flag pattern, and also Friday appears to be a gap and go to the downside. Stocks gap up, Bonds gap down. Stocks press against new highs, Bonds press against new lows. The top in Stocks is not in, the bottom in Bonds is not in.
Gold (GLD)
The "fear gauge", the "end of the world" trade, Gold has gotten crushed this year. Gold tried to stabilize and rally back from the July low, but was unable to take out the $138 high from June and has since continued lower. I did have some interest in this setting up to break the downtrend, but any reversal attempt is taking longer than it should for a strong reversal. This just simply needs more time and there are clearly better places to put your money at this point.
The whole point of what I'm trying to do here is show how you can use the behavior of price to avoid the weakest and more high risk areas of the market. At the same time, identifying where the strength and relative performance in the market is. By looking simply at price you can see what is working and what isn't. That's the name of this game: Put your money into the places that are working, not the ones who are failing to keep up.
If you had a typical "asset allocation" portfolio model, at the age of 50 (which would likely mean roughly a 50% stock, 40% bonds, and 10% Gold), the typical mutual fund or 401k strategy would have half of your money tied up in these two horrible preforming asset classes. This "diversification" has not only cost you a significant loss on half of your investments, it takes away from the gains you have seen in your correctly positioned stock exposure.
I'm trying to help people see the returns that are possible and the very small amount of risk it takes to acquire those returns. With those "buy and hold", asset allocation models, you maintain 100% market exposure
at all times. Are those kinds of returns worth 100% risk? With a trend following strategy you are never exposed to the large scale crashes because your trend signals invalidate before the bottom falls out. With a simple online brokerage account you can safely and successfully manage AT LEAST a portion of your investment savings with this simple trend following strategy.
This stuff is not magic, folks...Its Chart Porn!