Wednesday, January 1, 2014

Year in Review 2013 part 1

The next couple weeks will be dedicated to reviewing the past year. We need to take a look at how our picks performed relative to the overall market, which Sectors fared best in 2013 and what looks like it will continue to lead into 2014. This week we are going to review our Top 10 Holdings one by one to see trend and patterns that will give us hints toward future performance.

Some of our selections dramatically outperformed the market averages and others did not. We had a few big winners in DDD, HAIN, and PBW, while several names traded more or less in line with the SP500 like WFC, CMI and HD. We then also saw several names dramatically underperform the averages such as F, AAPL and ENB. This is mostly what we have come to expect when picking groups of stocks; some of the picks do very well, some fall in line, and others fail to live up to potential. Whatever the outcome turns out to be in hindsight, it doesn't change a thing in how we approach the next setup. We simply take each stock on its own setup of trend and trade it without bias. For example AAPL has been a poor relative performer overall this year finishing up only 5%, yet we are currently up over 18% in our position since entry, which would in fact be a pretty decent year relative to the averages. So it really depends how we manage each position and not necessarily the exact YTD returns that matter. But it is good for review purposes to at least take a look at the passive return of each pick to get an idea of underlying strength/weakness in the market.

Lets take a look at our Top 10 Watchlist stocks. The charts will reflect the Daily, 1-year view.


DDD     +155%
3D Systems was the big winner this year for us. Up a stellar 155%, this is what everyone hopes for when they pick a stock. Everyone loves a "double" and DDD didn't disappoint. After some very volatile trading in the beginning of 2013, it took a 6 month sideways consolidation breakout to really blow this thing open. This type of "explosion" in share price though is why we like to follow sideways consolidations near all-time highs after big rallies. Typically they allow for the stock to cool off and for supply and demand to gather equilibrium. Then once balance of supply and demand shift (by breaking out of the consolidation) you can see very powerful moves that make your year. I will continue to do my best in identifying these types of setups as we have done this past year. From coiling, tight trading ranges, come violent moves that can be extremely profitable if one can correctly identify them ahead of time.

HAIN    +65%
Hain was a very solid runner up for 2013. Finishing with more than twice the return of the SP500, Hain was  impressive. The stock had to deal with the large selling from Carl Ichan's liquidation of his stake in the company this year, and I was surprised how well price digested that surge in supply of shares in the late summer. Most people consider big investors like Carl almost bulletproof in their actions, yet Hain gathered itself orderly and has now made two new all-time highs since his sale in late August. I read a few articles calling for "the Top" for Hain after Ichan's sale, but I continue to yield to what price actually does, and here the price trend suggests more upside to come. It doesn't look like price cares what Carl did with his shares, the stock simply absorbed the sale and is ready to move forward.

Basically from the peak in late August though price has traded more or less sideways between $88 and $72. This past week however it seems that the consolidation could be over and the next leg higher is beginning. It looks to me that a breakout is underway and we could see a nice strong surge heading into the next earnings report. We can also move our stop up to the lows just below $80 now. This has been a consistent winner and we need to continue to follow the trend higher.

PBW      +54%
Clean Energy made an impressive showing this year. I don't like to pat myself on the back or anything, but we did pretty much nail the bottom so far in the Clean Energy space. We are seeing one reversal setup flow into another and each one is larger than the last. This is what we look for in terms of positive price action and secular reversal moves. Energy use is expanding in the US and with a Democratic president in office it is often Clean Energy that gets a strong funding boost. While we have recently taken a cash position in this space, I do expect this to continue to setup bullish price action and create many more profitable opportunities for us as we go forward.

PPG       +38%
We switched to PPG midyear, but it continues to show strength. PPG replaced a failed watch list stock (MOS) and has since been a leading performer in our Portfolio. I have been watching this recent, 3-month sideways price action for a while now. It is interesting because it is occurring above the prior channel resistance barrier and at all-time highs. When a stock can extend beyond upper resistance levels and hold them, it is a very bullish thing. Once again though it will be a break of the range that will be of importance. A break below will likely cause a correction down to the lower channel support, while a break above will simply indicate more upside to come. I believe this will resolve itself higher, but will be watching the support levels at $180 closely.

WFC      +33%
Wells has been a solid performing stock this year. It has been a leader in the XLF group and a laggard as well at times. We have recently reentered a position into WFC and I believe this continues the uptrend higher. Basically all the gains for the year were achieved between January and July. Since that July high the stock traded sideways and is only now emerging from that range. With the recent break to new highs, Wells could have a lot more upside ahead. Our new trailing stop on the position is going to be just under the $43.25 lows.

HD         +32%
HD looks to be regaining its mojo from the beginning of last year. Similar to WFC, HD had nearly all of its yearly gains in the first 5 months. The stock has been choppy and range bound for over 7 months and is only now breaking through that upper boundary. I've been hearing a lot of chatter out there about how the next 5-10% pullback is truly imminent, but I look at a chart like this or WFC and I see a stock (a leading stock at that) that has been correcting through time for the better part of 6 months and is only now emerging from the trading ranges. When more people start guarding for protection, that is when the market keeps leaving them in the dust as it climbs higher. This is just an observation of my charts and the noise I am hearing. My charts say that a significant correction has occurred over the last half a year, and now these old generals are ready to step back into a leadership role.

CMI       +29%
Cummins was the example of a "market perform" stock in 2013. It had its moments but they were short and if you missed them, all that you got was chop for multiple months at a time. However at the current moment it appears that CMI is emerging from one of those ranges into a "good" period for the stock. The stretch from late June through early September was truly sweet. The stock rallied 30% over a 3-month period of time. It then corrected through time for the next 3 months and now seems poised to surge once again.

  I think CMI will see strong new highs in 2014. There is currently a large Cup/Handle formation in motion for CMI with a projected target of $162-174 depending on where you draw your Cup neckline. I seem to favor the closer of the two targets because the $162 target acknowledges the breakout and throwback at the end of October. The corrective move retested the $122.50 neckline perfectly and seems like the pattern level the market is paying attention to most.

The point is this has significant upside potential going forward and I think its just getting started.

SP500    +29%
The SP500 had a record year. It was just a fantastic year for stocks. This rally has had many doubters and has left them all in the dust. We continue to see support levels hold and new highs being set. As long as that's the case, we are very constructive on stock prices going forward. 

F             +18%
Ford has cooled off lately, but if it can regather itself, 2014 could be another good year. F was really humming along for the first half of the year, but has since experienced a similar fate to many of the larger stocks. The corrective action from July to December had been more or less constructive. It was the breakdown last week that has changed the picture here in the near term. I was really expecting $16 to hold as strong support, when it failed, we closed out our remaining position. If this can turn around quickly here I think it would create an very interesting false breakdown and would be worth a look back into our account. There is still the massive base formation under construction and that could lead to dramatically higher prices in the future.

AAPL     +5%
This one made great strides in the last half of the year and seems poised to lead into 2014. While many of our prior leading stocks were taking a breather from July through December, AAPL was just getting itself together to give the market a well timed pick me up. When names like HD and WFC were topping for the year, AAPL was bottoming in a major way. We have seen a textbook uptrend over the last 6 months and prices still seem poised to continue higher. The stair-step action here is very encouraging as it creates very reasonable trailing stop locations along the way. Lets stay with this as long as we can, they say big things are in store for Apple in 2014. We'll see if the stock agrees.

ENB       +0%
Enbridge really had a tough second half of the year, but I remember a time early last year where it seemed it would never come down. Now its holding at a flat return for the year. If it can maintain the $40 level as support, I think it could go on a nice run.

Total Top 10 picks       +42%    vs   +29% for the SP500

While we had some big leaders and laggards this year, our total 1-year passive return for our picks outperformed the SP500 by 13%. This is exactly the type of return i hoped to see when I selected these stocks for our list at the beginning of last year. Lets see how they get this new year started.

--
Often at year end most people will try to predict what next year will bring. They dig up any study that suggests that due to the strength this year, next year will be strong/weak based on their findings and they will stick to that prediction when making current portfolio choices. This is something you will NOT find me doing.

I will not be one for trying to predict what next year will bring good or bad, I will simply maintain a flexible approach to the market and let it tell me when my investments are poor or strong. Here's a little hint, nobody knows what's coming...the future is uncertain, that's what we have to deal with. The best we can do is recognize strong movements and weak movements, and position ourselves as correctly as possible relative to the strength and weakness.

That being said, currently our charts suggest strength for the intermediate term trend heading into 2014 and we will continue to be positioned that way until the market proves our current holdings wrong.

Saturday, December 21, 2013

Weekend Update: The Fed Tapers and the Markets say...Yay!?

What a week for the markets, but first thing first, we had 3 changes to our Portfolio that need to be addressed prior to next week. We have added 2 positions and lost 1 as of Friday's signals. We have finally received a strong entry signal for the Financial ETF (XLF), we entered a short position in Gold and we sold our remaining position in Ford. Lets take a look at each of these individually, then we will get to this week's wrap-up.

 Entering Financials (XLF)
I have been watching this breakout to new highs for the XLF but hadn't received confirmation from volume and the Relative Strength trend vs the SP500. Well this week we saw too much price action confirming a bullish bias. Since price has taken out its prior highs it has consolidated nicely and retested the prior resistance level. This week saw a strong push off of that level confirming the breakout, but this time volume surged with the move. We also saw XLF:SP500 make a breakout of its own...

While the breakout is very early, we have been waiting for a sign that the Financials were ready to outperform the market and take a leadership role. This week's action in price as well as RS shows that money is flowing in strongly and I believe the XLF is ready to lead once again.

Entering Short Gold
I have made a separate post for this trade here. Being that its a Short position and is new to our study I think its important to look at it a little more in depth. Please take a look at it even if you are uninteresting in shorting positions. I am showing and introducing that trends can be traded in either direction and that the entry/exit signals are nearly identical. Being that we are in a liquidity filled Bull-Market, shorts are not as favorable in strong uptrends. However there will come a time when our bias lean heavily short just as they now lean heavily long. Markets trend in cycles and we will see a time where the trends are down. This is just an introduction to taking the other side of a trade, if you are interested in that.


Exiting Ford (F)
We have been neutral on Ford for some time now. We were maintaining a half position from our original holding and this week's action showed enough weakness that we will step aside and book our remaining gains. There are about as many signals as I can have triggered simultaneously; the prior significant swing low from $15.70 failed to hold, as did the 18-month rising uptrend support. We have also seen the move come from beneath a rolling over 20 WMA and it came on VERY high sell volume. This all occurred on one of the best weeks for the market all year as well. When we are talking Relative Strength, this fails the test miserably.

It is true that there seems to be the formation of a massive 12-year base reversal in the making, which would be extremely bullish for potentially years to come. But this has not triggered and the shorter timeframe is signalling a lower probability setup going forward. There should be strong support around the $14.30 level and if this will have any chance of fulfilling the base reversal, this level will need to hold and stabilize shares.  

---
Now, back to the normal weekend recap. I was very surprised to see the Federal Reserve "taper" their stimulus program. I was even more surprised that the announcement was met with a surge in the market averages. First I expected no action from the Fed this month, and if they did reduce purchases I fully expected the market to trade significantly lower on the news. This just shows how "thinking" and "predicting" is a really terrible investment strategy. Even if we correctly predict the news, we still cannot predict how the market will react to that news. Which leads us to feel even more confident in following what PRICE says and not what some economist or analyst says will be the reaction.

I couldn't have been more wrong with my assessment of what would transpire should the Fed taper their stimulus, yet I profited fully on the outcome because I don't trade what I "think", I trade what I see. This is a fantastic lesson for all, including myself. 

Here's a look at the SP500 and this weeks' breakout to new all-time highs

After trading sideways for the better part of the last month markets took a definite turn for the positive, surging to new all-time highs on very strong volume. While the market has churned recently, it never traded below the prior resistance level and old highs. The SP500 has managed to hold that short term support and is now lifting off of it with force. The 20 WMA is beginning to play some catch up and once it catches up a bit more, that short term support will have more significance sharing it with the 20 WMA. Lot's to like going forward!

We saw big moves in many of our holdings this week also, lets look at the best performers.

DDD
3D continues to rip. At the slightest inkling of weakness, traders rush in to buy every little dip. With the exception of that large outside week we saw 5 weeks ago, the price action is simply stellar. Relative Strength is continuing to rise, as is volume on this advance. The only real issue we have is that since price has run basically straight up, we have no well defined support levels to adjust our stops. The best thing to do with a winner like this is to simply hold on for the ride. Once we see a cooling in the price we will be able to use that consolidation as our new support base and stop location. As of now I think it's best to be very positive with any consolidation above the "outside week" low at about $70. The 20 WMA is beginning to rise sharply and should catch up as price moderates a bit.

I mentioned last week how when the market is weak you really want to focus on those stocks that performed well during the broad market weakness. I highlighted DDD's performance last week and you can see what happens to those relative winners once the market turns positive...those stocks continue to lead with even more outperformance.


HAIN
HAIN continues to act well. It seems to be continuing its pattern of "consolidate and pop"; it will chop sideways for several weeks and then it will pop to new highs. We seem to be in a new "pop" phase with the very strong move we saw this week, finishing at new all-time weekly closing highs. With this week's surge we can move our stops up to the low of the consolidation range and prior resistance near $79.50. This stop coincides with the 20 WMA, prior swing low and 1-year uptrend support. A clean break through that level would be enough to take profits and wait for better price action.
 
CMI
Cummins finally looks like its ready to resume its uptrend after holding strong support and rallying this week.. CMI also made a new weekly closing high and looks like a winner going forward. Our stop remains just below the support level at $128. The risk/reward here looks amazing! New positions can be added on this week's signal.

WFC
Wells followed the Financial sector higher this week and finished at new all time highs. The move out of the recent correction looks to be sustainable and I think this has upside written all over it. New positions can be added here as well with stops below $42.75 or a little looser stop at the low near $41.70 depending on how aggressive you want to be.

ENB
While Enbridge's chart is far from as pretty as the others above, it is notable how well it has acted since testing the lows of our support. We saw a nice accumulation bar in volume this week (buy volume exceeds the previous bar's buy volume). In fact this is the third time price has tested the $40 level and seen a surge in buy volume. This is certainly a secondary indicator but it does show definite interest in shares at that price level, which is a good thing for us. This will continue to be our stop going forward, now we want to see the prior closing high at $43.76 taken out.

---
The rest of our holdings saw modest gains in general but didn't set any new highs. With the overall positive price action this week following the Fed's trimming of stimulus, we have to expect that the market wants higher prices going forward. The Fed has said they will remain accomodative for the foreseeable future and that the economy is gaining traction. The market seemed to like what it heard this week and people are beginning to come around to the idea of a higher stock market and improving economy. Individual investors are gaining confidence and we could see this continue for much longer than most people think is reasonable. Sentiment can be a very powerful thing and when its starts gaining momentum, it can do great things for equity prices.

But we will continue to do what we do and that is follow price and ignore noise. It has worked well for us and we will continue to invest in the direction of the dominant trends.


Wednesday, December 18, 2013

Entering Short Gold

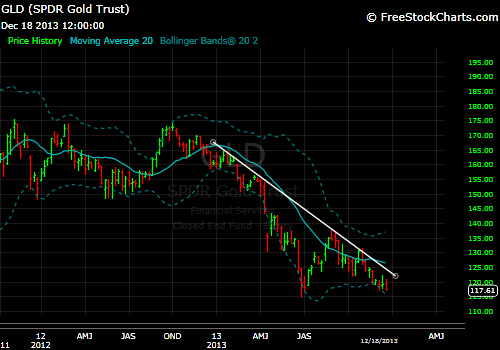
I'm going to throw some new stuff at you here, something I haven't done in a while is enter a short position. Do understand that my signals work for both up and down trends. You simply buy and go long uptrends and short downtrends. We haven't had too many downtrends in the groups we have followed this year, but i have recently decided that within our ETF tracking, we do follow Gold and Bonds and we should include them as asset classes for investment going forward.

That preface aside, this is just a really simple and clean downtrend. It looks just as nice as some of the strong stock uptrends we have seen this year. This one just happens to be flipped over.

 Here is the longer term downtrend. We can see that price is steadily declining underneath an also declining 20 WMA. I've been watching this for a while closely and today's action signaled an entry.


  We have some pretty bearish price action on the zoomed in Daily view. While price attempted to break to the upside last week it was unable to sustain anything and has since gapped back lower and today extended below the consolidation. Volume was also really high today adding more confidence to the move.

When the long term charts are showing the trend, and the short term views confirm the break, that is what we like to see. Multiple time-frame setups lead to higher probability trades.

We will use the $126 level as our stop and will enter at tomorrow's open.

Even If You Knew, Would it Matter?

I am often asked what I would do if the Jobs numbers come in weak, or if the Fed decides to reduce their stimulus, or what if that company doesn't hit their earnings targets? People wonder if I would sell my stocks. You would be amazed at how difficult it is to explain to someone that it really doesn't matter. Doesn't matter?! How can it not matter if the Fed reduces its stimulus activity?

This is what I try to explain: It's not the number itself that is important, all that matters is how the market handles/interprets the number. The Jobs number could be weak and the market could rally because it means the Fed would continue to ease. The Fed could reduce (taper) its stimulus and the market could sell off. The Fed could reduce (taper) its stimulus and the market could rally.

It's not the news that is important (the "why" rarely matters), it is the reaction by the market to the news that matters (the "what" is most important). So if they told you at the open this morning that the Fed was going to reduce their bond purchases by $10B per month at 11:00am, what would you do with your holdings? If you are like most reasonable people you would decide to sell at least some of your stocks to protect yourself...The Fed is going to take its foot off the gas a bit, so the market likely will too. It should correct and I will protect my profits from a strong year. That's what You, Me, and most anyone else would do. And its smart, we've had nice gains this year and why take a chance giving back those hard gained profits when the market will sell off into the disappointing stimulus announcement?

...and we would have been 100% correct...

At 11:00am the Fed announced the taper, the SP500 was at 1,780. At 11:01am the SP500 was at 1,768. That's a 12 point drop in a matter of seconds! It looks like a lot of people wish they would have known the outcome ahead of time, like us. They could have gotten out of the way more quickly too.

We would have been spot on, for 1 whole minute...

At 11:05am the SP500 was at 1,794 and never looked back, closing at a new all-time closing high.

Wait! What?! What just happened to logic and our plan?! Oops, I guess the market doesn't give a shit about your plans. Go complain to the guy who bought your shares this morning and is now riding off into the sunset.

You see, its not the number or the news that matters. All that matters is what the market says matters. Far to often people are caught up in the "why" and the "what" takes them to the cleaners. I know many people think they can anticipate the news and predict the future. But really, no one can.

You still want to guess that Jobs number or the next Taper amount? Let me ask you this, even if you were right, would it matter?

Saturday, December 14, 2013

Weekend Update: Consolidation Continues

*First off, I need to apologize for suggesting that the December Fed meeting was suppose to be held this last Wednesday. It is in fact this coming Wednesday and I wanted to clarify that.

As I suggested last week, it appears that the market is going to acknowledge the prior pattern of consolidation/pullback after breaking the upper boundary of the Bollinger Band. We saw the first substantially negative week for the market in over two months. No significant technical damage was done in the major averages on the longer time frame, but it was notable enough to be mindful of where the key supports are going forward. Lets take a look at the Weekly S&P chart:

Once again these arrows show the recent instances of where the market had poked through its upper range. In each case price either traded sideways or lower in the subsequent weeks that followed. Since its most recent violation we have seen two sideways weeks and now a decidedly negative move. This is just something to be mindful of.

The most important things will be the key support levels just under current prices:

First we will be watching the upper triangle line that has now acted as support since its breakout back in October. That will be the short term level of interest as well as the horizontal support from the 3 week consolidation at the end of October and early November...That low is right near 1,745.

The next and most important level to have on your radar is the intermediate term uptrend support and rising 20 WMA. Ultimately a break of the 1,700 level will be needed to seriously threaten the current rally.

The last line of defense of the uptrend will be the current swing low within the trend at 1,646. A break of that low will suggest a trend shift that we have not seen in over a year. That will be a time to become very cautious and the market will be in a "prove it" mode. That's still a long way off, so there is no reason to anticipate that move and panic here. But it is important to know the risk levels we face as the rally continues.

Lets see if we can hold the short term support and triangle breakout in the coming weeks.

--Now we need to take a quick look at our Top 10 list and see where everything stands heading into the final two weeks of 2013.

Enbridge (ENB)
Enbridge has been testing the lower boundaries of its support and our stop out level. While it has been crushed since we bought it, buyers seem to finally be coming in at the $40 level and supporting shares. We have seen two weekly bars showing bullish wicks after bouncing off of the weekly lows. But there are problems here as we are now squeezed between the support at $40 and a now declining 20 WMA. Being below a declining 20 WMA is not the highest probability place to be, but if the $40 continues to hold, that would be positive going forward. While the position has been far from great, it has managed to hold twice now and its time to show what the real intentions are for the next wave in prices.

PPG
PPG continues to hold up really well. I've been waiting for this thing to correct for the last several months and it just never goes lower. It is still holding above its upper channel line and continues to find aggressive buyers on any decline in prices. Nothing much else to say here, stick with it.

3D Systems (DDD)
Since the larger reversal week we saw a month ago, prices have steadily continued to climb. This week prices finished at new all-time closing highs while the S&P went through its first corrective week in two months. I love to see a stock perform so well when the market is weak. Also notable is the fact that since the large selling week, volume has shown two consecutive accumulation weeks and higher volume is accompanying the new highs in price. All good stuff.

While we are not fully positioned here we do still maintain a half position from our original entry. This is exactly why you never sell your entire holding in a strong uptrend. Nobody can call the tops consistently and big trends can continue much longer than most would consider reasonable. We will continue to hold our 1/2 position going forward and await the inevitable consolidation before we determine our new stop levels and new setups to add back to our holding.

Hain Celestial (HAIN)
HAIN continues to hang out at all-time highs. Its most recent pattern has been to consolidate and pop, then consolidate and pop. Right now we are consolidating, and until the uptrend support fails we have to assume that the pop will follow. I'm very pleased with the setup going forward and think there is still plenty of upside to come.

Apple (AAPL)
AAPL is holding very nicely since rallying hard recently. There is not too much to say here except that as long as prices hold the support band at $500 and the Relative Strength continues to trend positively, you want to be positioned along with this uptrend. This is a very nice bullish rounded bottom formation and the long term bull market seems to be resuming.

Home Depot (HD)
HD has the look of a stock ready to surge and resume its strong uptrend. Since taking out its downtrend resistance 5 weeks ago, price has flagged really nicely and seems ready to bounce right off the retest area and 20 WMA.

Cummins (CMI)
CMI has been in stall mode for a few months now. That being said it has been able to hold onto the prior all-time highs and should be ready to continue higher. The RS trend is sliding right along the uptrend support and will either bounce or roll over. Price is just hanging right on my stop level also, closing right at the rising 20 WMA and prior high inflection support. A break and close below that level will see us exit.

Wells Fargo (WFC)
WFC has a very similar look to Home Depot and is flagging since breaking its downtrend. This looks really good above about $42.

Ford (F)
Ford continues to show signs of rolling over but the price trend is not quite dead yet. This week was a follow through week from its 20 WMA failure and is now about to retest the key uptrend channel we have been following closely. We have a reduced holding and will continue to stay with the name as long as price can stay above the uptrend support and key low at 15.70. I am not encouraged by the RS trend failure we have seen and will need to see a quick stabilization to get re-interested in this longer term. A breakout above the $18 area would be quite notable, as would follow through above $19 which would set into motion the large Inverse Head/Shoulder base we have discussed previously.

Clean Energy (PBW)
We had one change to our Portfolio this week and that was the exit of PBW. We saw a clean breakdown of the uptrend support, 20 WMA and inflection swing point from the failed breakout. While the longer term setup (as shown above) has some very intriguing potential, we are better served to step aside for now and await a more positive setup. I hope this just holds around the $5.50 area and turns right around. But I can't be sure it will do that, it could just as easily roll over from here and resume the long term downtrend. Only time will tell, but if this stabilizes and breaks out, we will get right back in.


That's about it for this week. It will be interesting to see how the market handles the Fed meeting on Wednesday as many on the Street feel that they will begin to reduce their asset purchases. I don't see this happening since it is the final Fed meeting with Ben Bernanke as chairman. It just doesn't make any sense that they would begin to change policy with a lame-duck chairman, especially considering how dovish new Chair woman Janet Yellen has been when addressing future stimulus activity. But as we well know, the market doesn't care what I think and will do as it sees fit. We will be best served to simply follow our plan and ride our winners, while keeping a watchful eye on the key support levels for the SP500.  

Wednesday, December 11, 2013

Exiting Clean Energy (PBW)

We have received an exit signal on our Clean Energy fund with today's action. This has been warning us for a couple weeks that things might not actually be as good as they seem on the surface. The Relative Strength had broken its uptrend while price was attempting to hold a multi-year breakout. Usually a divergence in the Relative Strength like that leads to short term weakness. We were also watching the uptrend support, 20 WMA, and support zone from the prior consolidation and breakout...All those levels were broken today. We saw the market close convincingly below the $6.00 stop we had in place and will take our exit signal at the open tomorrow.


Here is a weekly view of the failed breakout attempt and then subsequent roll over in price. Let's zoom in a bit to get a closer look at the breakdown.


This is the closer look of the 8-month uptrend channel. If you recall we took partial profits after its big run up to the $6.35 mark (here). We then saw the stock push through the overhead resistance level and we bought back our shares (here). Unfortunately that happened to be the top it seems. I noted that we should expect some "healthy consolidation" above the $6.50 area when we added back to our position. We did see 5- weeks worth of cooling after our entry, but the last 3 weeks have broken below that $6.50 support and then today finally took out our lower support band. With the Relative Strength having broken the uptrend also, it looks like a more hefty correction is needed before continuing.

Here is a look at what we should be watching for at this point going forward. We should book our gains and wait for something more positive to develop.

So here is the potential Bullish case I can make for this space. I can see this pullback creating a possible Right Shoulder formation to a large reversal base. Remember with these technical patterns, in a positive trending and strong stock, reversal patterns will build upon themselves and often create other opportunities with larger patterns that form. When we entered this position back in May it had just broken out above a small reversal Head/Shoulder pattern at $4.80. That pattern completed itself and has now formed the Head portion of the larger potential formation. Positive action often begets more positive action.

 Now that we have no position and have booked a 25% gain since the initial pattern breakout, we can observe with no bias what happens next. If it forms the Right Shoulder and sets up, we will get right back into this baby. But as of now the risk simply outweighs the reward. That's all timing the market is; it's trying to get your money in when the gettin's good and taking it aside when the probability shifts to a more negative likelihood.

Bottom line, long-term this is a space to be invested in and be mindful of. But short-term it is time to take profits and let it settle out in a more favorable setup.

Sunday, December 8, 2013

Weekend Update: Strong Data = Media Taper Mania Continued

Well the SP500 closed lower finally, after 8 higher weekly closes in a row, the market posted a red weekly bar. Of course it only finished 1.8 points below last Friday's final trade. Not to say that nothing happened this week, because we certainly had a choppy ride to our first lower close in over two months. At one point the S&P was down almost 2% from last Friday's close, but a strong November payrolls number cleaned up much of the damage and left us once again testing the highs.

There still is rampant speculation that the Federal Reserve will begin reducing its stimulus efforts at the December Fed meeting which is this coming Wednesday (there is practically zero chance of this happening). The economic data has been very strong, signalling that the economy may be strong enough to stand on its own with less Fed intervention. This rash of strong economic news has led to itchy traders trimming some gains and anticipating a Fed reduction. It has also lead to the wonderfully accurate (I'm attempting to be as sarcastic as possible) media analysts/pundits calling for this reduction in Fed easing. It is really starting to drive me nuts when listening to these media sources. All I hear is analyst after analyst spouting off these amazingly complex theories about where they "think" the market will go next and why it can't continue to move higher. From someone who follows price action and trend strength, there is simply WAY TOO MUCH THINKING GOING ON!

All you hear on these financial shows are, "I think", "I think", "well I thought", "I think"...Who gives a rats ass what these people who are constantly wrong THINK! I sure as hell don't care what they think. I suppose I just need to turn off my tv and radio, but there is just something that keeps me listening. I guess its the every so often Carl Ichan interview that makes me laugh, or hearing one of the few commentators I actually enjoy (or maybe I'm just too much of a junkie). But why can't these so called professional investors focus on a plan or a system for investing that doesn't require needing to know the exact day the Fed will taper or when the market will break its uptrend? Wouldn't someone who manages money for a living have some hard and fast rules to keep their investments on track in moments of high emotion? Or would they just do like most everyone else and panic along with the crowd?

The one main thing I take away from an afternoon of listening to CNBC is how relieved I am that I have a solid trading plan that doesn't involve hitting the "trade" button based on what every analyst thinks or what a pundit says I should do with my money. Having a plan means having conviction in your own ideas and having the confidence to take signals regardless of what the masses think of my transactions.


SP500
Here's the weekly chart of the SP500. Each arrow above points to when price exceeded the upper Bollinger Band and then led to a subsequent correction/consolidation. Since the recent move above the band just a month ago we have seen the market trade more or less sideways. This is very typical action and in no way represents a major corrective top; the market runs hard, gets a little overheated and needs to cool off a bit. While we may see some more weakness or sideways trading over the near term, the longer term setup still looks intact.

The other thing I notice from this week and two weeks ago is the long lower "tail" on the weekly bar. That shows that while prices sold off intra-week, they were strongly bought and finished near the highs into the weekly close. That is strong action and these are what are called "bullish wicks". The "wick" comes from another major charting style known as Candlestick charts. We have looked at these before. But the takeaway is when you see a long tail, wick, shadow, etc on a weekly bar, it means while prices were initially taken lower, downside pressure could not sustain and buyers took back control. For our sake of discussion this is a good thing and something to look for.

---
Since we had no changes to the Portfolio this week, let's revisit our Sector Groups and see where we need to adjust our stops going forward.

 Financials (XLF)-- Cash
  Here is the Daily chart of the XLF. While I have been stubborn with this position since exiting back in September, I still see the Relative performance against the SP500 as in a downtrend. Relative Strength has not confirmed the breakout in price. While I struggle to let this continue to go on without entering a position, I still think I need to see a little more. If price takes out the high near $21.60, I will enter as that will show a breakout, follow through, pullback, and again confirmation of new support. I would expect the Relative Strength to break the downtrend if that happened, but I would then take the position regardless based on the individual strength in price.

I actually like many of the individual names within the XLF more than the ETF itself. I currently hold two of the top 10 holdings and am entering a 3rd at Monday's open. Currently we hold WFC for the Portfolio, I hold BAC in personal accounts and will be adding MET on Monday. With many of the individual names breaking out and showing strength, it seems to only be a matter of time until the group follows.

Discretionary (XLY)--Invested
After the most recent advance and break to new highs, there seems to be nice level of support along with the 20 WMA right near $61.75. A breakdown of that area with a RS confirmation, would be enough to let me book the gains on a strong year.

Technology (XLK)--Invested
Tech has been smoking hot over the past nine weeks, and looks to be a trend that will continue. The Relative Strength chart says it all here. I'm actually going to post a larger version of the RS to zoom in:
This is the Weekly chart of the XLK Relative to the SP500 over the past 18 months. After lagging severely for nearly all of 2012 and then continuing into mid-2013, it appears that the ratio is about to turn back in favor of the XLK sector. The white trend lines depict a symmetrical triangle formation that is breaking out to the upside. The grey support line shows an area of interest coinciding with the prior swing low. If the XLK:SPY ratio were to fail here and break below that support, it would likely be a bad sign for the market and very bad for Technology. But right now it looks picturesque for bullish activity and a trend shift. Pair that with prices continuing to hit new multi-year highs and you have a sector looking to outperform for some time to come.

Our stop however still sits below the $31.38 low prior to the recent rally. I expect the stop to rise once prices consolidate and for a new low to trade off of. When a stock moves straight up it is often hard to raise your trailing stop as the most relevant support/demand area is still at the prior breakout level.

Industrials (XLI)--Invested
I much as I would like to raise our stop to the $48 area, there is just not enough of a retested support to call that a stop level. The XLI did acquire its upside target near $50 over the recent weeks, so that does make me want to be conservative. But we also need to give this strong performer room to pullback and still continue higher. If we raise our stop too soon it opens the possibility of getting a false signal. We end up getting shaken out near the lows of simply a corrective profit taking, not a full blown trend failure. We should sit tight for a while with this one.

Materials (XLB)--Invested
Materials have been acting weak for the past month now and the Relative Strength trend seems to be struggling with multiple resistance areas as it appears to want to roll over. While I like this uptrend, I am getting a little spooked by the recent weakness relative to the overall market. That being said, we are not selling here and would still need to see more than 5% of downside before our stop is even tested. I will be watching for the support band to hold and for Relative Strength to break to the upside out of the larger downtrend pattern.

Energy (XLE)--Invested
Energy is in a similar situation as Materials. They just can't seem to keep it going in terms of relative performance. The stock continues to grind slowly higher, just not at the same pace as the overall market. there has been enough interest at the $84-83.50 area to make me tighten the stop on this potential lagging group. A clean move through the support zone and 20 WMA will see our exit.

Staples (XLP)--Invested
The Staples have been holding their breakout and have just cooled off into the breakout retest area. We have also seen nice accumulation of shares on the initial breakout and now the retest bounce. I think this goes higher. Our stop continues to be the swing low near $39.50. We have no reason to tighten the stop yet as the trend indicators are intact.

Health Care (XLV)--Invested
Health Care continues to perform well and we now have an anchored support level from the prior breakout highs and 4 week consolidation over the last few months; this shaded area also holds the 20 WMA. A clean break below $51.35 would stop us out.

Utilities (XLU)--Cash
Utilities, while showing a potential breakout from a symmetrical triangle pattern, have really struggled to continue putting a rally together. They are showing a nice trend of higher lows, but we would need to see a higher high above the $39.50 peak before we would want to get interested. Relative to the market, the Utilities have sucked lately and don't represent an appealing space at the moment.


20+ Year Treasury Notes (TLT)---Cash
Treasuries continue to be weak and can be shorted on a breakdown of the prior low.

Gold (GLD)---Cash
Gold continues to be weak and can be shorted on any bounce attempt below $132.

---
Overall the trend continues to be higher for stocks and the offensive sector groups are doing the heavy lifting. I really like what I'm seeing out of Discretionary, Technology, Industrials and Health Care. I also am encouraged by the price performance of the Financials. With all of the nonsense buzzing around the media you would still think we are in a bear market. Its refreshing to be able to take a step back from the noise and really see the clear picture of the market and what is actually happening instead of what some analyst thinks will happen next. We try to simply take prices one week at a time, with as an objective eye as possible. And we are not easily swayed by the ramblings of others.

We have had a great year here folks, it will really get interesting when things turn the other direction and you can see how easy it is to protect those gains you've made and how you don't have to watch your accounts evaporate when the market seriously corrects. We will take our signals and step aside. But until that time comes we continue to follow the trends higher.