Thursday, September 30, 2021

Wanna Rassle?

 WWE (World Wrestling Entertainment) has come across my screens again recently. After taking a quick trade post-Covid, I moved on from the name with a chuckle and a solid ring of the register. 

Professional Wrestling is a difficult entertainment to take seriously. About as seriously as I've ever taken it is while playing drinking games based on which bizarre events would unfold at WrestleMania 

But a look a little deeper into the business of rassling shows a very promising picture in my view

Profits and Sales are at record highs 

Total Equity is at all-time highs

Forward EPS estimates project to be solid double digits for the forseeable future

The fact that it is taken as more of a joke than a strong growth stock is likely because of the nature of the business itself. But pro wrestling bias aside, the company is making money and growing solidly. 

I think this bias from the general observer gives the stock even more of a value aspect. People disregard the stock as they disregard the sport (if we can call it that). 

I am trying to look at this from an objective point of view. My scan popped the opportunity, the chart passed my "eye" test, Fundamental metrics are what I consider very strong and ideal for continued growth, I've recently come off a successful trade prior in the name, and its an under-loved stock because of the silly nature of its product. 

WWE Monthly Bull Flag rotation with a now rising 20 Month SMA under price

This rotation up gives us a confirmed swing low to trade against for a strong risk/reward. With Fundamental metrics at record highs this looks like a value entry for the stock trading -45% off the all-time high price. 

WWE Quarterly


Despite the stock being relatively weak over the last few years which might put some traders off, zooming out shows the larger performance and the trend that is in place. 

Since the IPO the stock traded higher by +500% into the 2018 highs and was more than an +1100% return from the 2012 lows to the 2018 highs. The most recent correction has simply been a digestion of that prior huge rally. 

From my view the stock has a good chance of resuming higher after a lengthy reset. Based on the Monthly timeframe we can take a relatively tight Stop and see what happens. 

Monday, October 26, 2020

ABBV A Good Value After Pullback

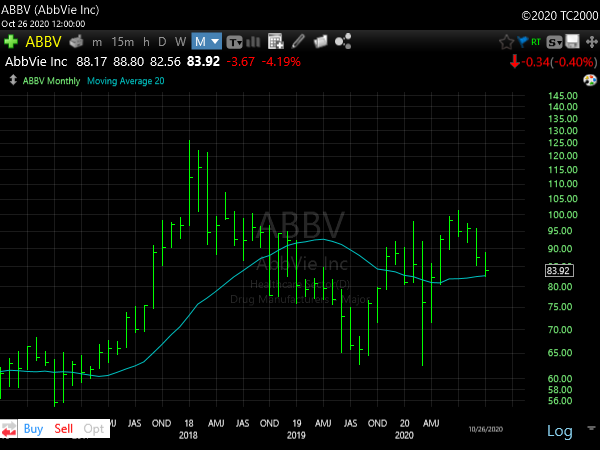
 I'm buying ABBV here as prices have retraced to notable trend support. There are a few confirming factors that suggest it is ready to resume higher. 

Monthly

The stock responded off the March lows along with the broad market. It has since pulled back to the rising 20 Month SMA for the first time since ABBV underwent a 2-year Bear Market. 

When a stock has corrected for 4-months, the vast majority of "enthusiasm" has been extinguished. Yet on this higher timeframe it is simply resetting to the trend average. Shorter-term traders that chased the upside off the lows are now shaken out and sentiment is back to a more neutral posture. 

I treat these reset type pullbacks as strong "value" areas for entries. 

Weekly
It is common after a strong rally for price to retrace roughly 50% of the prior uptrend; as I like to call this "two steps up and one step back". This happens on all timeframes and when I see it happening on a larger timeframe I get excited by the prospect of buying into the pullback. 

Daily
Zooming in a bit on the correction it appears price has formed out a 5-wave sequence. During Monday's broad market selloff note that ABBV did not make a lower low and in fact closed well off the lows of the session. This to me suggests price may have exhausted on the downside. 

So many traders focus too much attention on short-term and Daily charts. This "zoomed in" view can miss the bigger picture. Despite the notable correction in the stock over the last few months, don't lose sight that this is not a downtrending stock. The Quarterly chart is always a good reference to keep in mind and shows the long-term performance since its spin-off from ABT 


Throw in the 5.6% Dividend Yield and this is offering a very favorable risk/reward. I will be using a -10% Hard Stop from my entry point here to exit and reassess. 

I have added shares for personal and Client accounts, as well as some January $100 Call options for trading accounts. 

Tuesday, August 11, 2020

A lot to Like in BYND

 BYND sets up a strong risk/reward on the Long side 

1st Weekly Higher Low since IPO. 8+ week pullback into the now rising 20 Week SMA is the first sign of a bullish retracement in a rising trend. 

Post-Earnings ABC pullback + gap fill

The Daily chart shows some "tails" the last couple days as the gap support was tested and held

Sale and EPS numbers are really picking up and they just announced a very solid quarter. I think playing this against the Weekly swing low at 120.32 makes a lot of sense, risking roughly $8 per share

 I currently and Long shares here for Clients and personal accounts. I also hold Aug14 $130 Call options. I will continue to be opportunistic as long as price cooperates and holds above the recent lows.

I can be reached at cody@zentrendstrading.com, @ZenTrends on Twitter/Stocktwits

Tuesday, March 17, 2020

(UPDATE) Energy Shows Value-levels Unrivaled Since Banks in '09

**UPDATE**
5/12/20
We are now 6-weeks into this trade and its been nothing short of fantastic. Almost all of my initial hopes have been achieved. Honestly I thought I'd be writing this update in a year or so, not less than 2-months from positing.

Now that nearly all the upside gaps from 3/6 are filled I am cooling off on the thesis somewhat, or rather moving onto phase 2. The speed of which this recovery has occurred is causing me to dial back some exposure and I am working toward free-roll position sizes.

For the last two weeks I've been slowly trimming off small amounts of these trades.
FANG is up over +100%, RRC +100%, MTDR was up more than +550% at its highs on 4/30 and currently +450%, MR +125%, RDS.A hit a +55% gain early after entry and currently +30%, CVX +30%

I am looking to take my size down by about another 1/3 over the next month if prices cooperate. The remaining amount I plan on holding more or less forever and only make very small adjustments over time to the positions. Many of these pay decent dividends, so I would like to sit back and bring that in over time.


We all know Energy has been the worst performing sector group for the last several years

Energy hasn't just been the worst performing sector, its been notably disastrous, especially in the last 2-years (declining -65% since 2018). This recent correction followed the first leg down beginning in 2014 (a decline of -50%). Between these two significant corrections this group has lost -73% of its value over the last 5+ years' Bear Market.

The recent meltdown phase is being aided by the plunge in Oil prices after OPEC could not reach a production-cut deal. Russia and Saudi Arabia are at an impasse and prices are tanking. I have to think we are headed back higher sooner rather than later as political pressure will begin if the market cannot stabilize. If OPEC can strike some kind of deal, Crude will be back at $50 really quickly. If they cannot strike a deal and the current Bear Market environment continues, we will likely see a lot of bankruptcies among our domestic producers.

Okay so that covers the obvious, all of this stuff is well known by market participants, investment managers, and Mr Market. Lets look at some things that aren't so obvious taking place under the surface:

The vast majority of the stocks in the E&P sector are being priced as though they are going bankrupt, and I think many of them likely will. However I also think that the ones that survive and do not go bankrupt could be offering a generational value opportunity.

Most all of these companies are boasting a Price/Book Value of between 0.50-0.15. A Book Value of 1 suggests the stock is trading right at its base value of Assets - Liabilities. When the market values a company's growth and future prospects positively, the stock will generally trade well above a P/B of 1. When the market values a company's future prospects as poor or in distress, the P/B ratio will plummet below 1. This is where we find the majority of these companies right now.

The question I have is: If Energy isn't completely done as an investment thesis, which companies that are being priced for bankruptcy are likely to survive and reverse their trends?

There are two things I am noticing between those names that are likely to survive and those that are not: The first is Debt to Equity, and the second is Sales

The big dogs like CVX, XOM, RDS.A, EOG, CXO, etc are the most insulated from bankruptcy as their Debt/Equity ratios are fairly benign. However those are the few that boast this kind of protection. Most everything else I am seeing are showing Debt/Equity > 0.50. So if we want to play it safe in this space those five above are likely some of the better prospects. The "safest" plays however are not going to give us those maximum returns. In order to get the lotto ticket type returns I am looking for in this group I want to find some of the names that are priced for bankruptcy but have a better chance of surviving.

This is where checking in on the Sales trends might help. Sales trends seem to be a separating factor when skimming through the rubble. It appears to me that about half of the E&P companies have Sales near their all-time highs and the other half are steadily lower and some at the all-time lows.

I want to avoid those that are struggling to sell their products and focus on those that seem to be conducting solid business despite this brutal environment.

A few that stand out to me right away, showing bare bottom prices plus strong Sales trends are COG, FANG, RRC, MR, MTDR. The other item of note with these names is that they are also showing notable Insider Buying over the last few weeks. 

COG
COG is one of the few with a slightly elevated Debt/Equity that has not been priced for Bankruptcy. Sales are strong and prices are actually in a Bullish Monthly Reversal pattern with less than two weeks to go in March. We saw Insiders purchase the stock back in August near $16 per share and now prices are well above those levels. This is a strong position and nearing the upper echelon group mentioned above.

FANG
FANG is nearly back to its IPO levels and yet Sales are pegged against the all-time highs. This is a name I have been Long in the past and was finally Stopped out near the $90 level in 2019. Seeing this back near $20 per share is appealing to me to start legging in. The CEO stepped in and bought 17,000 shares on March 10th as well.

RRC
RRC is back to test the lows from the late 1990's while Sales sit near all-time highs. In 2000 Sales were below $500M, currently Sales are at $2.8B. There remains some potential here for improvement in share prices. Insiders are stepping in and have been peppering the stock near $2/share. One of their directors purchased 900,000 shares on March 10th. That's a $2M purchase! I realize this doesn't guarantee a bottom or financial stability for a company, but it is notable that this Exec feels there is enough value and potential here to drop a couple million of his own dollars.

MTDR
MTDR is another that I liked in 2017-2018. We were Long for our accounts as it looked to be breaking out to new all-time highs. We were Stopped out in November 2018 at $22.80/share and have since seen prices tumble more than 90% from that exit. This action looks like major trouble for the company yet Insiders are going crazy buying the stock over the last two weeks. Since March 9th 530,000 shares have been purchased. The CEO bought 240,000 of those on March 13th at $2/share.

Again none of this buying proves its safe, but it is notable to see these people with the most intimate knowledge of the company and business put their own money on the line here. Since I closed positions near $23, I think its worth throwing a little back in near $1.50 here and checking back in a few years.

MR
MR was previously known as Eclipse Resources and changed the name in Montage in 2019. Since that change the stock has been pummeled. I like however how price is holding near the prior swing low and Sales are at recent highs. There is no Insider Buying to note here, yet EPS growth projections seem decent at this time to warrant a little deeper look.

For my personal accounts I am adding all of these names at this time for a portion of my long-term allocations. I am allocating roughly 10% of my account to this idea and spreading the risk accordingly. I do fully expect half of these picks to go bankrupt and am planning my risk to account for that. I feel more confident with COG, FANG, and RRC so I am allocating a higher percentage of my funds toward those and a lesser percentage toward MTDR and MR.

I also have been purchasing CVX and RDS.A for long-term dividend accounts on the recent plunge. I will look to continue to average my cost into these two larger companies provided they do not completely fall apart going forward.

I have added speculative position sizes of RRC and FANG to our most aggressive Client Accounts and will look to be opportunistic if they do in fact improve going forward.

I do not intend this thesis to be a short-term trade. I am planning on hunkering down with these select positions and letting them do their thing. I feel that there is a deep-value opportunity unmatched since Banks during the Financial Crisis in 2009. As an example of this lets take a quick look at BAC in the heart of the 2009 meltdown period

BAC
 The waterfall collapse looks eerily similar to many of the Oil companies we are comparing. BAC's stock went from a high near $60 and fell below $3 over the course of a couple years. Note that Sales were near all-time highs when prices hit their lows showing a solid business backdrop despite the panic and looming bankruptcies that were coming into the Financial sector.

I'm not saying these are the same because obviously there was government intervention that came into the Banks. I do not know what will happen in the Energy sector with regard to bailouts. But I am mostly just pointing out how we have seen these kind of collapses before and while some companies went bankrupt then, many or most survived and now are thriving.

There are no guarantees when it comes to investing in the market, especially so when the companies in question are looking to be overflowing with unsustainable debt. But I feel as long as our allocations are set to a point where catastrophic losses in the companies themselves do not implode our accounts, it is worth a lotto ticket purchase at this time.

We have not been destroyed by this Oil crunch and this is a very important distinction for us stepping in here. Sitting on the sideways watching this carnage and not suffering losses has allowed us to observe with a clear head. We are operating from a position of strength and have the capital to take a few swings for the fences now that reluctant Longs have been puking positions over the last year or more.

Value investors always like to say "buy when there is blood in the streets", I get the sense we are really really close to that moment in the Energy sector.

I can be reached on StockTwits and Twitter @ZenTrends. I manage Client Investments at Freeman Capital Management and offer Educational/Trading Services at zentrendstrading.com

Thursday, September 5, 2019

Short-Term Base Breakouts

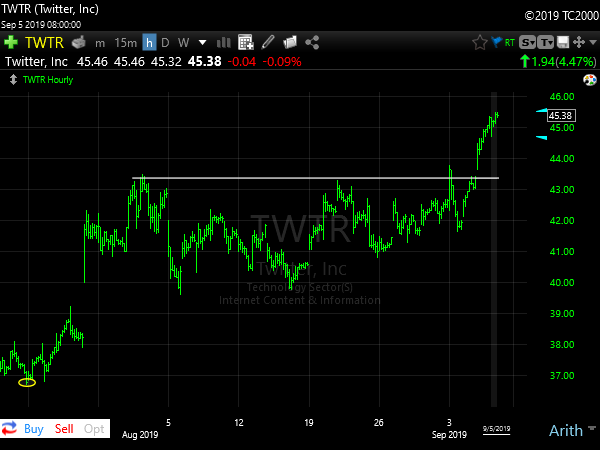
We've seen some very clean 4+ week base breakouts on the Hourly charts. This appears to be a nicely correlated move with broad participation.

AKAM

ALLY

AMZN

FXI China

JPM

MA

SMH

SPX

TWTR


Thursday, July 25, 2019

Amazon (some random thoughts)

Amazon is a monster, behemoth, the generational no-brainer investment for my lifetime. By every metric I trust, it says to buy, hold, buy more on dips, hold, etc.

Take a look:


This is the breakdown on FinvizElite: Its hard to see but here are some highlights-

EPS grew 335% this year and is set to grow 39% and 61% over the next year and 5-years respectively. EPS Quarter over Quarter grew 116% with Sales Q/Q up 17%. 

The EPS graph in the middle left of the screenshot is pretty amazing; EPS in 2014 was -0.52 per share, in 2015 +1.28, in 2016 +5.00, and in 2018 +20.36! It looks like they can just turn their earnings on like a spigot. 

It continues to get better...The Sales graph in the middle shows the trend there. No explanation needed. Sales are growing 

The third graph is Shares Outstanding. Notice how much discussion there has been and continues to be made regarding share buybacks by companies to artificially boost their EPS and "manipulate" the market? Well, AMZN's Shares Outstanding over the last 5-year have actually grown from 462M to a little over 490M. No buybacks here to stimulate EPS. And just imagine when they do start to repurchase...Holy mackerel  

Now read this description of the company and what they do: (again provided by FinvizElite) 

Amazon.com, Inc. engages in the retail sale of consumer products and subscriptions in North America and internationally. The company operates through three segments: North America, International, and Amazon Web Services (AWS) segments. It sells merchandise and content purchased for resale from third-party sellers through physical stores and online stores. The company also manufactures and sells electronic devices, including Kindle e-readers, Fire tablets, Fire TVs, and Echo devices; provides Kindle Direct Publishing, an online service that allows independent authors and publishers to make their books available in the Kindle Store; and develops and produces media content. In addition, it offers programs that enable sellers to sell their products on its Websites, as well as their own branded Websites; and programs that allow authors, musicians, filmmakers, skill and app developers, and others to publish and sell content. Further, the company provides compute, storage, database, and other AWS services, as well as compute, storage, database offerings, fulfillment, publishing, digital content subscriptions, advertising, and co-branded credit card agreement services. Additionally, it offers Amazon Prime, a membership program, which provides free shipping of various items; access to streaming of movies and TV episodes; and other services. It serves consumers, sellers, developers, enterprises, and content creators. Amazon.com, Inc. has a strategic partnership with Volkswagen AG. The company was founded in 1994 and is headquartered in Seattle, Washington.


If those aren't the most fingers in some really big pies, then i don't know what beats it.

They sell merchandise to consumers, publish original literature/art, make and sell electronic devices, cloud services, produce television and movie content, Amazon Prime (which has apparently taken over the United States in about 3 years time) at a $100/year for more than half of all American households...That's just going to continue being a cash cow, and its only getting started.

You will be hard pressed to find such a safe, relentless growth story, and with a massively established infrastructure.

I joke with people that Amazon is what will become the real version of "Big and Large" from Pixar's movie Wall-e. I love that movie and feel this is actually a somewhat possible path for Amazon in some weird way. Bezos has his own space program "Blue Origin" which could slide its way into this whole picture some day as well.

The way I see it, it is going to be awful tough for this one to fail. Of course anything is always possible, but if I have to pick, I'd prefer an established company (the largest in the world in fact) that has grown EPS by 400% in the last 3-years, is expected to grow by 61% over the next 5-years, and is taking over most aspects of our consumer lives.

I don't say it lightly that I would buy/hold a stock blindly. That is not my game at all. But with Amazon I feel it is worth the small chance that they fail for the potential boundless upside in the unforeseeable future.

I will continue to use my Peter Lynch glasses to watch how consumers interact with the company; as of now I see countless packages delivered daily (I generally receive 1 to 3 packages per day personally), their original television content is winning awards, they continue to diversify and streamline their offerings in all areas (including shipping technology), Warren Buffett's Berkshire Hathaway has recently made a substantial purchase in the company, etc.

They appear unstoppable and destined to grow continuously. I honestly think when we look back in 30-years we will see that AMZN was the easiest and clearest long-term investment of our lifetimes.

Disclosure: I currently hold 10% of my liquid net worth in AMZN shares and will continue to average my cost over time. We are also Long AMZN for our Managed Client Accounts 

Wednesday, May 1, 2019

The ZenTrends "Markets are Going to Collapse" Newsletter

Its the end of the world as we know it.....

Following the Fed announcement on interest rates today markets reversed lower from all-time highs. It looks like we are headed for a correction. Just how deep? Nobody knows, but it will likely be painful...bet on that.

They are pitching bearish newsletter commercials on financial networks today, so I figured I better get on board for this wave of hot opportunity!

Here is the SP500 Weekly chart, take a look at some of these Fib levels for a little perspective of the doom we could see:

Pullbacks within "normal" boundaries can retrace 50%-61.8% of the prior trend. If this is to play out the levels of note are about 2,650 and 2,580 respectively...What will that do to your 200% Margin account? Death likely.

Probably my favorite bearish chart pattern is the "rising wedge":
Unfortunately I can't make this look like its failing yet, but you get the idea. When it breaks, oh boy we are gonna get smoked.

I've noted some other classic risk-off rotation that has begun to kick in as of the last couple weeks:

TLT has rotated up on the Weekly chart from a very orderly Bull Flag pattern
It seems money is rotating into Bonds and that tends to be a sign that investors are expecting some riskier action ahead.

I also note the new 52-week highs the US Dollar posted last week
Generally movement into the Dollar is a sign of protection-seeking rotation of funds. Its seems participants were anticipating some problems ahead with this recent strength we have seen. At the very least this should be a headwind to the internationally focused Mega-Cap companies in the SP500.

Ok so I've been a bit of an alarmist above. Maybe context doesn't come through on the text like it does in my head...In all seriousness, would a pullback really surprise anyone? The market is up 25% from the December low over the last 19-weeks; its been an absolutely torrid run.

What I am expecting is for the "air" from price to the 20 Week SMA to be filled in. This should create a Bull Flag-like pattern. Currently the 20 Week SMA is about 6.5% below the market.
I would view a consolidation like this to be a very bullish development. It would allow price to reset to the rising moving average and establish a new higher low or floor of support. The current move up has not paused long enough to create any viable support, price will need to discover some demand over the next several weeks, likely near the 2,800 level is my best guess.

A pullback from current levels would not be a disaster, well it could be a disaster for those who are leveraged to the hilt and not in any way prepared for lower prices however. I have been holding some fairly significant TLT positions waiting for prices to form a higher low. Its ok to be long stocks on this pullback, but its prudent to maintain some balance to take advantage of any potential weakness that may come in the weeks ahead.

For those who are about to die, I salute you...For everyone else, I'll see you tomorrow